
On this page
Most teams obsess over the top of the funnel: more traffic, more ad spend, more leads in the door. Far fewer look hard at the small resistances that make interested people give up halfway down. Those resistances have a name in conversion work, and reducing them is usually cheaper than buying more clicks.
A visitor who lands, reads your page, and reaches for the buy button is already sold on the idea. What happens between that impulse and the confirmation screen decides whether you get the sale. Friction is what happens in that gap.
This post defines conversion friction and the heuristic behind it, separates good friction from bad, maps the common sources, puts real numbers on what friction costs, and covers how to audit and remove it without collecting worse leads.
What is conversion friction?
Conversion friction is any element of a page or flow that adds mental or physical effort and makes a visitor less likely to complete the action you want. Unbounce describes it as the psychological resistance a visitor feels when trying to finish a task, and that resistance is what quietly turns interested people into bounces.
The most useful way to think about it comes from MECLABS Institute, whose Conversion Sequence Heuristic frames a conversion as the sum of forces acting on a visitor: C = 4m + 3v + 2(i - f) - 2a. Here C is the probability of conversion, m is the visitor's motivation, v is the strength of your value proposition, i is any incentive you add, f is friction, and a is anxiety. MECLABS is clear that this is a thought tool rather than an equation to solve, but the structure makes one thing plain: motivation and value push a visitor toward the goal, while friction and anxiety subtract from the result.
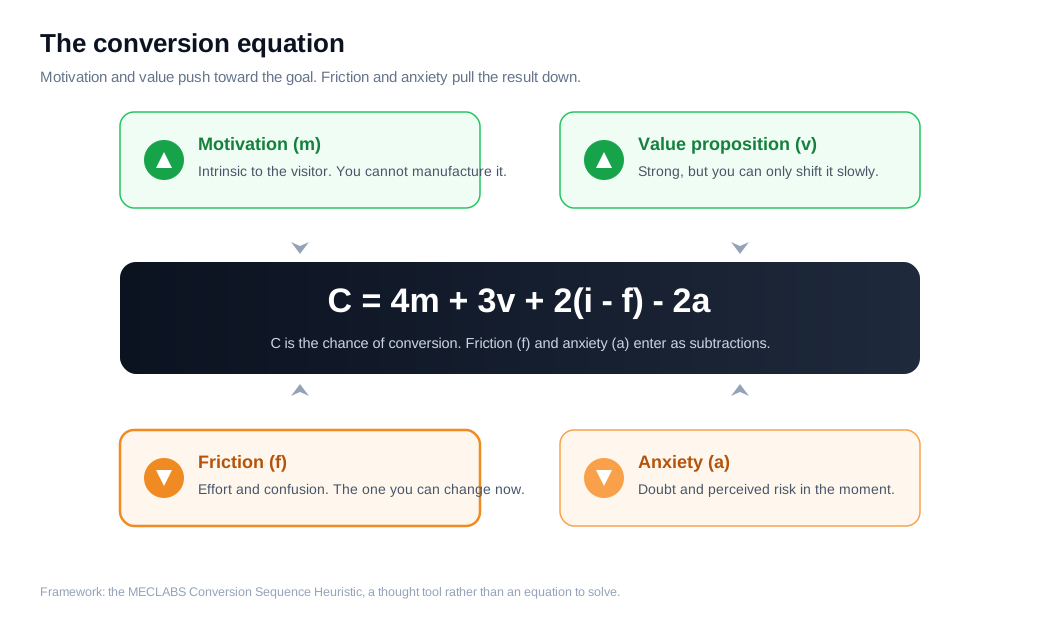
Two of those forces are largely out of your hands in the moment. You cannot manufacture a visitor's motivation, and you can only shift your value proposition slowly. Friction is the variable you can change this week. Removing a confusing field, cutting a page-load second, or clarifying a button label lowers f directly, and because it sits inside the equation as a subtraction, every bit you remove flows straight through to a higher chance of conversion.
The WiderFunnel LIFT Model gives the same idea a slightly different shape. It treats value proposition, relevance, clarity, and urgency as conversion drivers, and anxiety and distraction as the two inhibitors that drag results down. Friction lives right alongside those inhibitors, as the accumulated effort and doubt a driver has to overcome before a visitor acts.
Is all friction bad, or is some of it useful?
No, not all friction is bad, and treating every extra step as an enemy is how teams end up with a high conversion rate and a pipeline full of junk. Some friction filters. When a visitor takes the time to answer a qualifying question or wait through a short form, that effort is a signal of intent, and it screens out people who were never going to buy.
The distinction that matters is between friction that protects the buyer and friction that only protects your process. Good friction asks the visitor for something that helps them get a better outcome, like a field that routes them to the right specialist or a question that tailors the demo they see. Bad friction asks for effort that serves your internal convenience, like a required phone number nobody ever dials or an account you force before checkout.
A quick test: for every step you ask of a visitor, name who benefits. If the answer is the visitor, keep it. If the answer is only you, it becomes a candidate to cut. B2B teams that strip every field in the name of conversion often learn this the hard way, watching form fills double while qualified conversations stay flat, because the extra volume is all tire kickers. Aim for the least friction that still separates buyers from browsers, not the smallest possible number of fields.
What are the most common sources of friction?
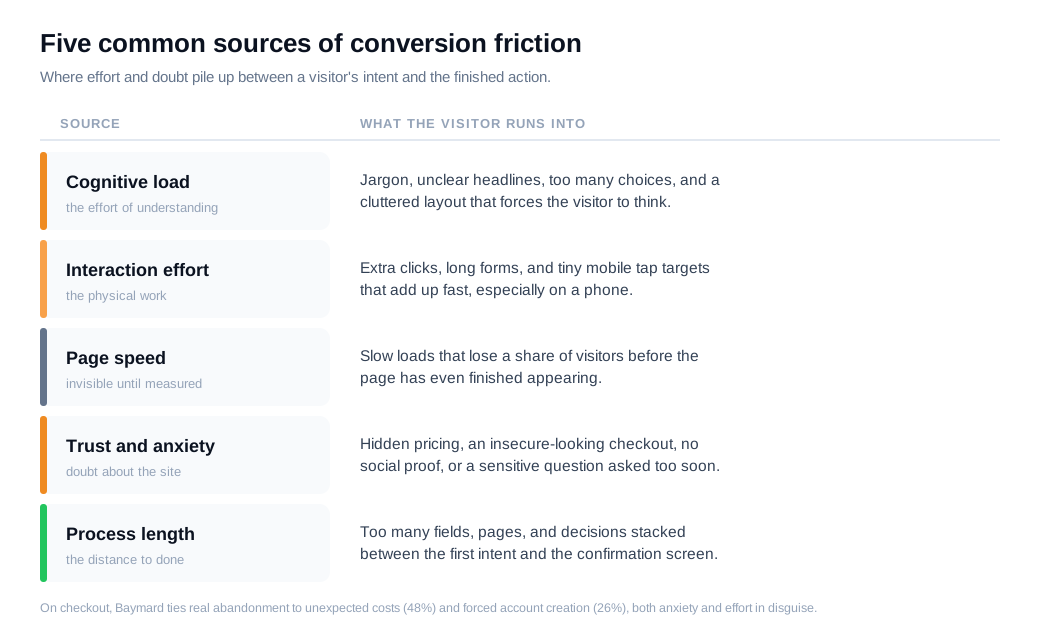
The most common sources of friction cluster into five groups: cognitive load, interaction effort, page speed, trust and anxiety, and process length. Most struggling pages have problems in more than one at the same time.
Cognitive friction is the effort of understanding. Unclear headlines, jargon, too many choices, and cluttered layouts all force the visitor to think harder than they should, and thinking harder is exactly what a distracted browser will refuse to do. The Nielsen Norman Group calls the total mental and physical effort of using an interface its interaction cost, and every ambiguous label or surprise question adds to it.
Interaction friction is the physical effort: extra clicks, long forms, tiny mobile tap targets, and steps that could have been combined. Each one is small on its own, and they add up fast, especially on a phone where typing is slow and the keyboard covers half the screen.
Speed is its own category because it stays invisible until you measure it. A page that takes four seconds to load has already lost a share of its visitors before they read a word, and the next section puts numbers on that.
Trust and anxiety friction is doubt: no clear pricing, a checkout that does not look secure, missing social proof, or a request for sensitive data before you have earned it. On checkout specifically, the Baymard Institute finds that 48% of shoppers who abandon do so because of unexpected extra costs, 26% because the site forced them to create an account, 25% because they did not trust the site with their card details, and 22% because the process was too long or complicated. Most of those are anxiety and effort wearing different clothes.
Process friction is length: the sheer number of fields, pages, and decisions sitting between intent and done. That same Baymard research puts the average documented cart abandonment rate near 70% across dozens of studies, and a long, opaque checkout is a large part of why.
How much does friction cost your conversion rate?
Friction costs more than most teams assume, and page speed is the cleanest example because it is easy to measure and hard to argue with. Portent's analysis of more than 100 million page views found that ecommerce sites loading in one second converted at about 3.05%, while sites that took five seconds converted at roughly a third of that. Speed is friction you can read off a stopwatch.
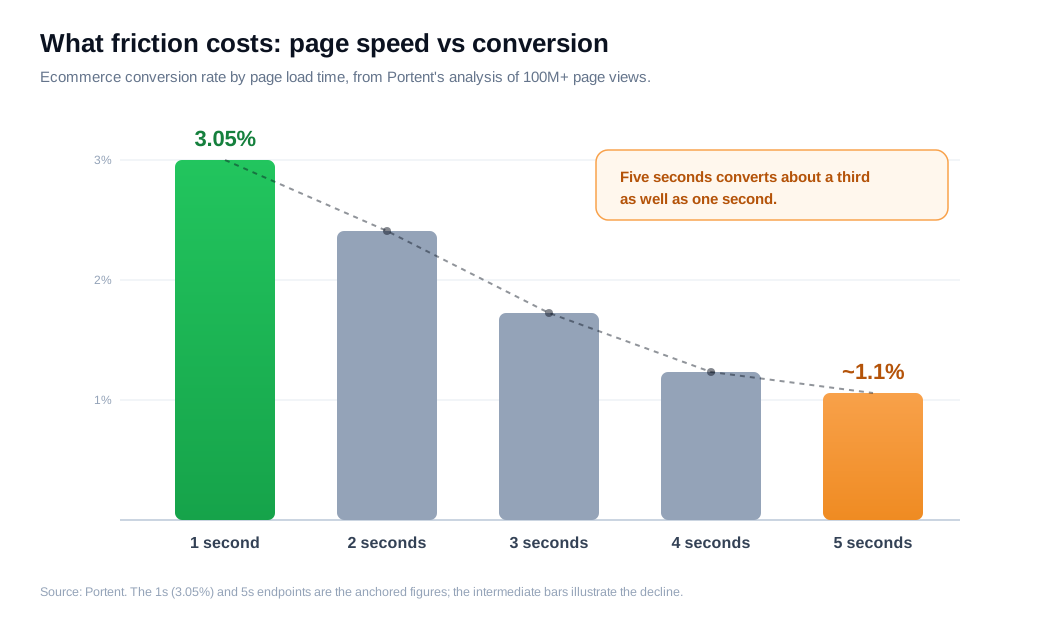
Here is the arithmetic on an ordinary store. Say you get 100,000 sessions a month and your pages load in four seconds, converting at 1.2%, which is 1,200 orders. You invest in performance and bring the median load time toward one to two seconds, and conversion climbs to 2.4%. Same traffic, same product, 2,400 orders. You doubled revenue by removing effort the visitor never wanted to spend, with no extra ad budget.
The same logic applies to every other kind of friction, it is just harder to isolate. A form with three unnecessary fields, a checkout that hides shipping until the last step, a signup that demands a password before it shows the product: each one shaves a few points off completion, and the points compound down a multi-step funnel. A flow that loses 20% at each of four steps delivers only about 41% of its starters to the finish. Trim each drop to 12% and you deliver 60%, a lift of nearly half, without touching your traffic.
How do you audit friction points?
You audit friction points by combining quantitative data that shows where people drop off with qualitative data that shows why, then walking the flow yourself against a heuristic like the one above. No single tool tells the whole story, so a real audit layers a few.
Start with funnel analysis. Build the ordered steps of your key conversion, from landing to done, in your analytics tool and look at the drop-off between each stage. The step with the steepest fall is where your worst friction lives, and it tells you where to point everything else.
Then watch what happens there. Heatmaps show where attention gathers and where it dies, and session recordings let you watch real visitors hesitate, rage-click a dead element, or abandon a specific field. This is where you catch the problems analytics can only hint at. For forms in particular, field-level analytics reveal the exact input where people quit, which turns a vague high abandonment rate into a named culprit.
Ask the visitors too. A one-question exit survey ("what stopped you from finishing today?") or a handful of moderated usability tests will surface reasons no dashboard can, like a term nobody understands or a trust worry you did not know you were creating.
Finally, walk the flow yourself as a first-time visitor, on a phone, on a slow connection, and score each screen against the heuristic: where is effort high, where is anxiety high, where is the value unclear. A funnel that says where, recordings and surveys that say why, and a heuristic walk that says what to change is what separates an audit from a guess. Watching your highest-intent sessions, like anyone stalling on the pricing or demo page, also tells you where a proactive nudge or a live answer would rescue the most revenue.
How do you remove friction without losing qualification?
You remove friction without losing qualification by cutting the effort that serves only you, deferring the effort that qualifies until later in the relationship, and replacing static forms with a conversation that qualifies as it helps. The aim is to keep the signal while dropping the drag.
Start by cutting dead weight. Every field, step, and click that no human actually uses to make a decision comes out. If sales never references the "company size" answer, it is friction with no qualifying value, and removing it lifts completion for free.
Then defer, rather than delete, the questions that do qualify. Progressive profiling asks for one or two pieces of information at a time across visits, so a first form takes an email and the harder questions arrive once the visitor is already invested. Multi-step forms use the same idea within one session: put the easy, low-risk questions first, save email, phone, and budget for later steps, and show a progress indicator so people know the end is near. A short first step earns the momentum to carry a visitor through the parts that qualify them.
Here is the trade-off in numbers. Suppose a demo form with seven fields converts at 8% on 5,000 monthly visitors, giving 400 leads, of which sales rates 60% as qualified, so 240 good conversations. You cut to three fields and completion jumps to 14%, or 700 leads, but with less to filter on, only 40% qualify, which is 280 good conversations. You gained qualified volume and lost some precision. The setup that usually wins keeps the two or three fields that genuinely predict fit and moves the rest into a follow-up, capturing both the volume and the signal.
The highest-leverage move is to replace the form with a conversation at the moment of intent. When a visitor is active on your pricing or demo page, a live chat window that asks one smart question qualifies them the way a form field would, except it also answers their objection on the spot and books the meeting while interest is still hot. That is the core of a fast inbound sales motion: treat a high-intent visitor as a live signal, qualify through dialogue instead of a gate, and let the rep or an assistant collect what matters in context. The effort that would have sat on a form becomes a two-line exchange, and the visitor never feels screened.
Key takeaways
- Friction is effort that subtracts from conversion. In the MECLABS heuristic it is the f that pulls against motivation and value, and because it sits there as a subtraction, every bit you remove flows straight to a higher chance of conversion.
- Not all friction is harmful. Good friction filters for intent, while bad friction only protects your process. Name who benefits from each step and cut the ones that serve only you.
- Friction clusters into a few sources. Cognitive load, interaction effort, page speed, trust and anxiety, and process length cover most of it, and Baymard's checkout data shows unexpected costs and forced accounts driving real abandonment.
- The cost is measurable. Portent found one-second pages converting near 3% while five-second pages converted about a third as well, and small drops compound across every step of a funnel.
- Audit in layers. A funnel shows where people leave, heatmaps, recordings, and surveys show why, and a heuristic walk of the flow shows what to change first.
- Remove friction without losing leads. Cut the effort that serves only you, defer the questions that qualify, and replace static gates with a live conversation that qualifies while it helps.
TAGS

Written by
Nilas MylerCo-founder & CTO, Glimpze
Nilas is the co-founder and CTO of Glimpze, an inbound sales tool that turns high-intent website visitors into live conversations. A former SEO consultant for some of the largest companies in Denmark, he writes about speed-to-lead, inbound sales, and conversion rate optimization — the technical and operational mechanics of turning traffic into pipeline.


