
On this page
- Why should you prioritize CRO experiments?
- What scoring models like ICE, PIE, and PXL exist?
- How do you score and rank a list of test ideas?
- How do you build a CRO testing roadmap?
- How do you balance quick wins and big bets?
- Which prioritization framework should you use?
- How often should you review and reprioritize your roadmap?
- What are the most common CRO prioritization mistakes?
- Key takeaways
- Sources
A conversion optimization backlog fills up faster than any team can drain it. Every stakeholder has a pet idea, every heatmap hints at three more, and one good research sprint can surface fifty hypotheses in a week. The inputs that let you test them, traffic, engineering hours, and calendar time, stay stubbornly fixed.
That gap is where prioritization earns its keep. Win rates in mature experimentation programs sit near one third of tests at best, so the order you run ideas in changes how much revenue a year of testing actually returns. A team that runs its five strongest hypotheses first will usually beat a team that runs fifty in random order, even though the second team ships far more experiments.
This guide covers why prioritization matters, the scoring models worth knowing (ICE, PIE, PXL, and RICE), how to score and rank a backlog, how to turn that ranking into a testing roadmap, how to balance quick wins against big bets, which framework fits your team, and how often to revisit the plan.
Why should you prioritize CRO experiments?
You prioritize CRO experiments because testing capacity is scarce and most ideas do not win, so the sequence you run them in decides how much value the whole program returns. A single test occupies a page for two to four weeks and needs enough traffic to reach significance, which caps how many experiments a site can run at once. The backlog, by contrast, has no ceiling.
That scarcity meets an uncomfortable base rate. In experiments run at Microsoft, roughly one third of tested ideas moved the target metric in the right direction, one third did nothing measurable, and one third made things worse, as Ron Kohavi and Stefan Thomke reported in Harvard Business Review. If two out of three ideas will not help, running them in a smart order matters far more than running a lot of them.
The cost of skipping prioritization is quiet but real. Without it, the loudest voice in the room wins, low-traffic pages soak up test slots they can never justify, and cosmetic tweaks crowd out changes that could actually move money. The same HBR piece describes a shelved Bing idea, a small change to how ad headlines displayed, that lifted revenue by about 12 percent and was worth roughly 100 million dollars a year once someone finally tested it. Good prioritization is how you surface those before they sit in a backlog for months. For a business that treats its website as an inbound sales channel, the pages where good-fit buyers decide whether to talk to you are usually where that hidden upside lives.
What scoring models like ICE, PIE, and PXL exist?
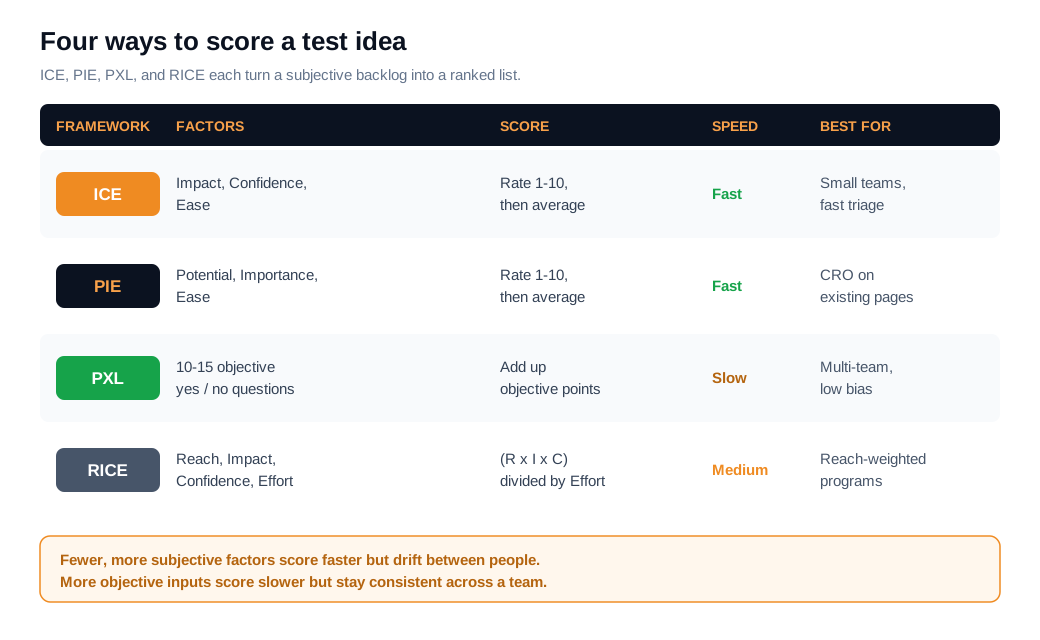
The main scoring models are ICE, PIE, PXL, and RICE, and each one turns a messy backlog into a ranked list by rating every idea on a few defined factors instead of on instinct. They differ in how many factors they use, how subjective those factors are, and how long each idea takes to score.
ICE is the fastest. Created by Sean Ellis for growth teams that run many small experiments, it scores each idea on Impact, Confidence, and Ease from 1 to 10, then combines the three into one number (teams commonly average them, though some multiply). ICE is blunt by design, which makes it excellent for triaging a long list quickly and weak at settling disputes, since anyone can nudge a score.
PIE was built for conversion work. Chris Goward and the WiderFunnel team introduced it to defend test choices to clients, scoring each candidate on Potential (how much room the page has to improve), Importance (how much traffic and value it carries), and Ease (how hard the change is to ship), as documented in Conversion's PIE framework. You rate all three from 1 to 10 and average them.
PXL trades speed for rigor. Peep Laja and the CXL team designed it to remove gut feel by replacing squishy 1-to-10 inputs with a list of roughly ten to fifteen mostly yes/no questions, such as whether the change sits above the fold or adds and removes an element rather than merely tweaking one, described in CXL's PXL framework. Because the answers are concrete, two people scoring the same idea tend to land in the same place.
RICE comes from product management and fits programs that weigh reach explicitly. Built by Sean McBride on Intercom's growth team, it scores Reach, Impact, Confidence, and Effort, then computes Reach times Impact times Confidence, divided by Effort, per Intercom's own writeup. Dividing by effort pushes cheap, wide-reaching tests up the list.
How do you score and rank a list of test ideas?
You score every idea on the same factors, combine those factors into one comparable number, and sort the list from highest to lowest, so the running order reflects evidence rather than who argued hardest. The value of a shared rubric is that it makes two very different ideas answerable to the same questions.
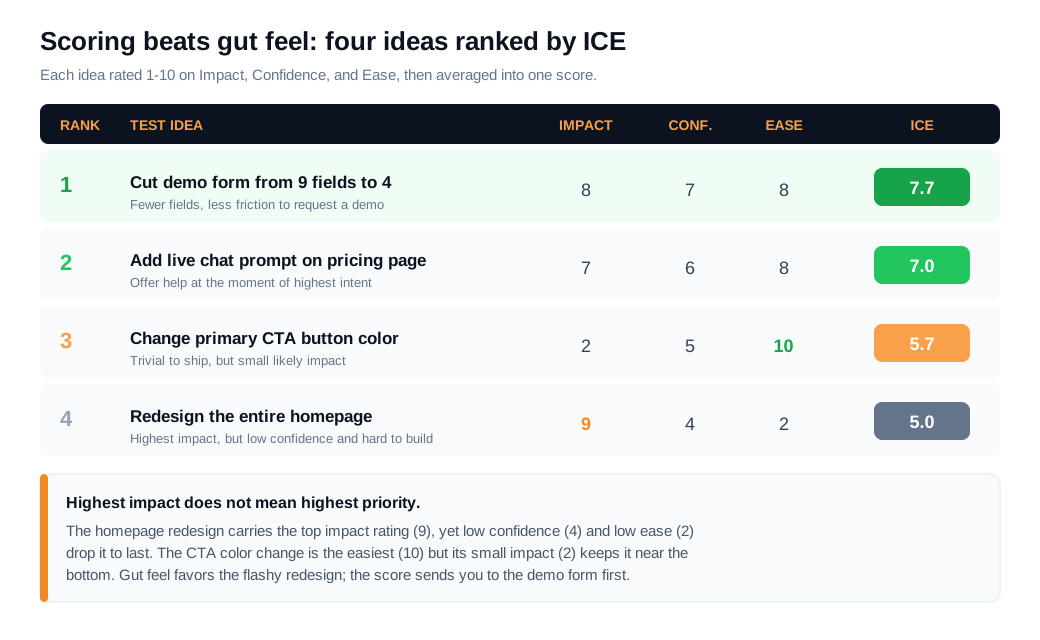
Here is a worked example using ICE on four ideas for a B2B SaaS site, each scored 1 to 10 on Impact, Confidence, and Ease and then averaged. Cutting the demo-request form from nine fields to four scores Impact 8, Confidence 7, Ease 8, for an average of 7.7. Adding a live chat prompt on the pricing page scores 7, 6, 8, averaging 7.0. Changing the primary call-to-action button color scores 2, 5, 10, averaging 5.7. Redesigning the entire homepage scores 9, 4, 2, averaging 5.0.
Ranked by score, the form change goes first, the live chat prompt second, the button color third, and the homepage redesign last. Two results are worth noticing. The homepage redesign has the highest raw impact yet lands at the bottom, because low confidence and low ease drag it down. The button color is trivially easy yet also near the bottom, because its likely impact is small. Gut feel would probably have started with the redesign, the flashiest idea. The score starts you somewhere far more likely to pay off.
A ranked list is only the first half of a plan, though. Scores tell you the order of value. They say nothing about which pages can run a test at the same time, how much engineering each idea needs, or how the ideas depend on one another. That is the job of the roadmap.
How do you build a CRO testing roadmap?
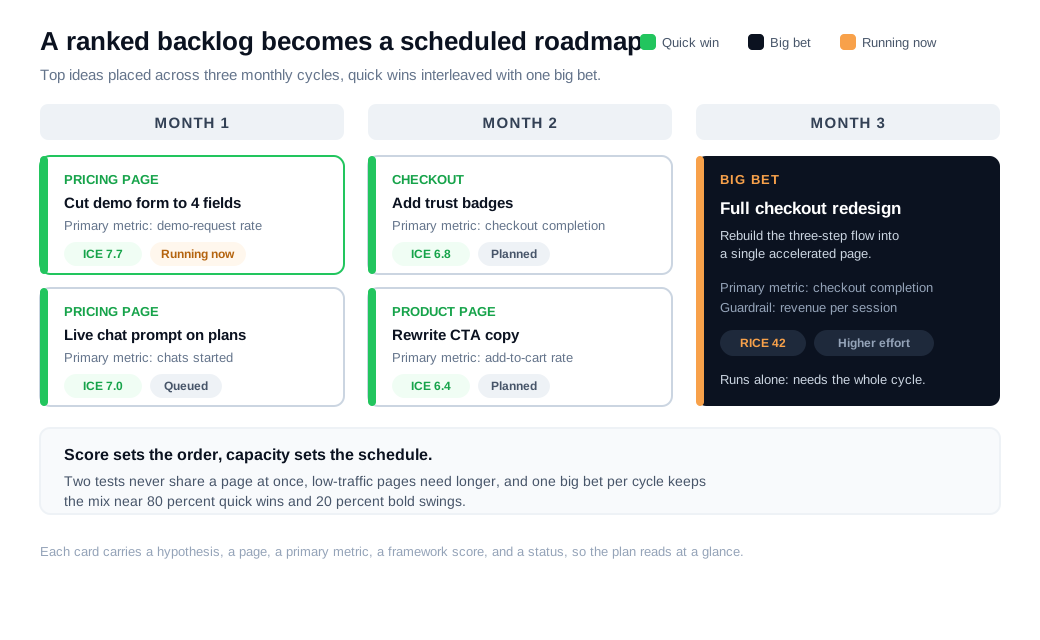
You build a testing roadmap by taking the ranked backlog and scheduling the strongest ideas across a fixed window, giving each one a written hypothesis, a primary metric, a target page, an owner, and an estimated duration. A roadmap is essentially a calendar for experiments: it says which test launches when, on what page, and what a win would look like, so the program runs on a plan instead of on whoever has a free afternoon.
Sequencing is where scores meet reality. You cannot run two experiments on the same page at once without contaminating both, so a lower-scored test often slots in ahead of a higher-scored one simply because its page is free. Traffic sets a hard limit too, since a low-volume page may need two months to reach significance while a high-volume one clears the bar in ten days. CXL's guidance on testing roadmaps and VWO's roadmap guide both treat the document as a living schedule that balances priority against capacity, rather than a fixed wishlist.
A workable roadmap row carries a few standard fields: the hypothesis, the page or flow, the primary metric and any guardrail metrics, the framework score, the estimated effort, the expected run time, the owner, and a status. Group the rows into short cycles, a sprint or a month each, and you get a schedule the whole team can read at a glance.
How do you balance quick wins and big bets?
You balance them by deliberately reserving most of the roadmap for fast, high-confidence tests and carving out a fixed minority for a few high-risk, high-reward bets, so the mix is a decision rather than an accident. A common split is around 80 percent quick wins and 20 percent big bets, a ratio that product leaders like ProductPlan describe for balancing short-term wins against big bets.
Quick wins are small, cheap, high-confidence changes: fewer form fields, clearer CTA copy, a trust badge near the checkout, a prompt that offers help on a high-intent page. They rarely transform a funnel on their own, but they compound, they build credibility with stakeholders, and they keep the testing habit alive. Big bets are the opposite kind of test: a full checkout redesign, a new pricing structure, a reworked onboarding flow. They carry lower confidence and higher effort, and most of them will lose, yet the occasional winner moves a number that no amount of button copy ever could.
The failure mode at each extreme is real. A program that runs only quick wins optimizes its way into a local maximum and gets leapfrogged by a competitor willing to test bigger ideas, a risk VWO frames as the big-test versus small-test balance. A program that runs only big bets burns months on low-confidence swings, demoralizes the team with a string of losses, and starves itself of the small compounding gains. AWA Digital describes the same tension as explore versus exploit, borrowing the language of decision theory: you exploit known winners with safe tests and explore the unknown with a measured number of bold ones. A useful rule of thumb is that quick wins earn the budget and credibility that let you fund the occasional big swing.
Which prioritization framework should you use?
Use the simplest model your team will apply consistently, and add rigor only when the scores start drifting between people. For a single small team with a healthy debate culture, ICE or PIE is enough, and its speed is a feature. Once several people score ideas and you notice the same test getting wildly different numbers depending on who holds the spreadsheet, move to PXL or RICE, whose objective inputs keep scoring stable across a bigger group.
Many teams settle on a hybrid, keeping the speed of PIE while borrowing PXL's insistence on evidence, an approach the Mida comparison of ICE, PIE, and PXL recommends for most programs. The exact framework matters less than three habits: everyone scores against the same definitions, evidence outranks opinion, and the score stays an input to the decision rather than the decision itself.
How often should you review and reprioritize your roadmap?
Review the roadmap on a fixed cadence, usually every sprint or every month, and re-score the backlog whenever a finished test, fresh research, or a business change alters what you know. A roadmap is a living document, and a score set three months ago is out of date the moment a related test wins or loses.
Feed every result back in. A winning test raises your confidence in adjacent hypotheses and often spawns follow-ups, while a losing one should lower the confidence score on anything built on the same assumption. New qualitative research shifts the picture too. Watching where visitors hesitate in session recordings, or asking a stalled buyer directly in a live chat session, surfaces objections that reshuffle the backlog. Skip the review and the roadmap slowly drifts from a plan into a museum of ideas that felt important last quarter.
What are the most common CRO prioritization mistakes?
The most common mistake is treating the framework score as a final verdict rather than a discussion starter, which lets a tidy number override obvious context like a page freeze or a dependency between two tests. Three others recur. Scoring impact and confidence from imagination instead of research, so the numbers just launder a hunch. Loading the roadmap with quick wins because they feel safe, until the program plateaus. And never re-scoring, so the plan calcifies while the site and the data move on.
Key takeaways
- Testing capacity is the real bottleneck. A site can only run so many experiments at once, so the order you choose decides how much a full year of testing returns.
- Most tests will not win, so sequence matters. With roughly a third of ideas helping the target metric at best, running your strongest hypotheses first beats running many in random order.
- Score every idea on the same factors. ICE, PIE, PXL, and RICE all convert a subjective backlog into a ranked list, so pick the lightest one your team will apply consistently.
- A ranked list is only half a roadmap. Layer in page conflicts, traffic, effort, and dependencies to turn scores into a real schedule with hypotheses, metrics, and owners.
- Reserve room for big bets. Aim for something like 80 percent quick wins and 20 percent bold tests, so you compound small gains without capping your upside.
- Re-score on a cadence. Feed every win and loss back into the backlog so confidence scores stay honest and the plan keeps up with what you have learned.
TAGS

Written by
Nilas MylerCo-founder & CTO, Glimpze
Nilas is the co-founder and CTO of Glimpze, an inbound sales tool that turns high-intent website visitors into live conversations. A former SEO consultant for some of the largest companies in Denmark, he writes about speed-to-lead, inbound sales, and conversion rate optimization — the technical and operational mechanics of turning traffic into pipeline.


