
On this page
- What is a customer journey map?
- Why do customer journey maps matter?
- What are the stages and touchpoints in a customer journey?
- How do you build a customer journey map?
- What are the different types of customer journey maps?
- How do you use a customer journey map to improve customer experience?
- Key takeaways
- Sources
A prospect finds your product through a link a colleague dropped in Slack, reads two of your blog posts, signs up for a trial at 11pm, gets stuck on setup, and cancels four days later without ever speaking to anyone. On your side of the glass, that whole story collapses into one line in a churn report. On the customer's side, it was a dozen separate moments, and at least three of them went wrong.
A customer journey map is what puts you back on the customer's side of the glass. It lays out the full path a person takes to reach a goal with your company, the steps, the channels, and the feeling at each one, so the moments that quietly lose people stop hiding inside a single number.
This post covers what a customer journey map is, why whole journeys beat isolated touchpoints, the stages and touchpoints that form the spine of a map, how to build one step by step with a worked example, the main types of maps, and how to turn a finished map into real customer-experience gains.
What is a customer journey map?
A customer journey map is a visualization of the process a person goes through to accomplish a goal with a company, laid out as a sequence of stages with the customer's actions, thoughts, and emotions at each one. Nielsen Norman Group defines a journey map as a visualization of the process that a person goes through in order to accomplish a goal, and its whole value is that it pulls scattered data points into one shared picture, as NN/G lays out in its journey mapping primer.
Most maps share a common skeleton. Across the top sits a specific persona and the scenario they are trying to complete, because a map that tries to describe everyone at once describes no one. Below that runs a row of stages, the high-level phases of the journey. Under the stages run a few lanes that fill in the human detail: what the customer does, what they are thinking, how they feel, and where the experience could be better.
The emotion lane is the part people remember. Plotted as a single line rising and falling across the stages, it shows where the customer is delighted and where they are frustrated, and it turns an abstract process into something a room full of stakeholders can react to. Salesforce frames the finished map as a tool for seeing the experience through the customer's eyes rather than through the org chart, which is exactly the shift most teams need.
Why do customer journey maps matter?
Customer journey maps matter because customers judge you on whole journeys, not single interactions, and journeys predict satisfaction and revenue far better than isolated touchpoints do. McKinsey found that customer journeys are 30 to 40 percent more predictive of overall satisfaction and willingness to recommend than individual touchpoints, drawing on analysis across industries like banking, insurance, and pay TV, as described in its work on moving from touchpoints to journeys.
The reason is the handoffs. A company can score well on every individual touchpoint, the call, the email, the checkout page, and still lose the customer because the seams between those touchpoints fail. Nobody owns the gap between marketing's promise and onboarding's reality, so the map exists partly to make those gaps visible before a customer falls into one.
The economics follow the experience. McKinsey has reported that companies which redesign their core customer journeys can raise revenue by 10 to 15 percent while cutting the cost to serve by 15 to 20 percent, because a smoother path both keeps more customers and generates fewer expensive support fires along the way. The stakes are high because expectations are high: Salesforce research finds that 88 percent of customers say the experience a company provides matters as much as its products or services.
There is an internal payoff too. Marketing owns awareness, sales owns the decision, product owns onboarding, and support owns the rough patches, and each team sees only its slice. A shared map is the one artifact where all four teams look at the same customer at the same time, which is often the first time they agree on where the real problem lives.
What are the stages and touchpoints in a customer journey?
The stages are the high-level phases a customer moves through toward their goal, and the touchpoints are the specific interactions inside each stage where the customer actually meets your brand. A widely used set of stages runs awareness, consideration, decision, retention, and advocacy, which Harvard Business School Online walks through with an example.
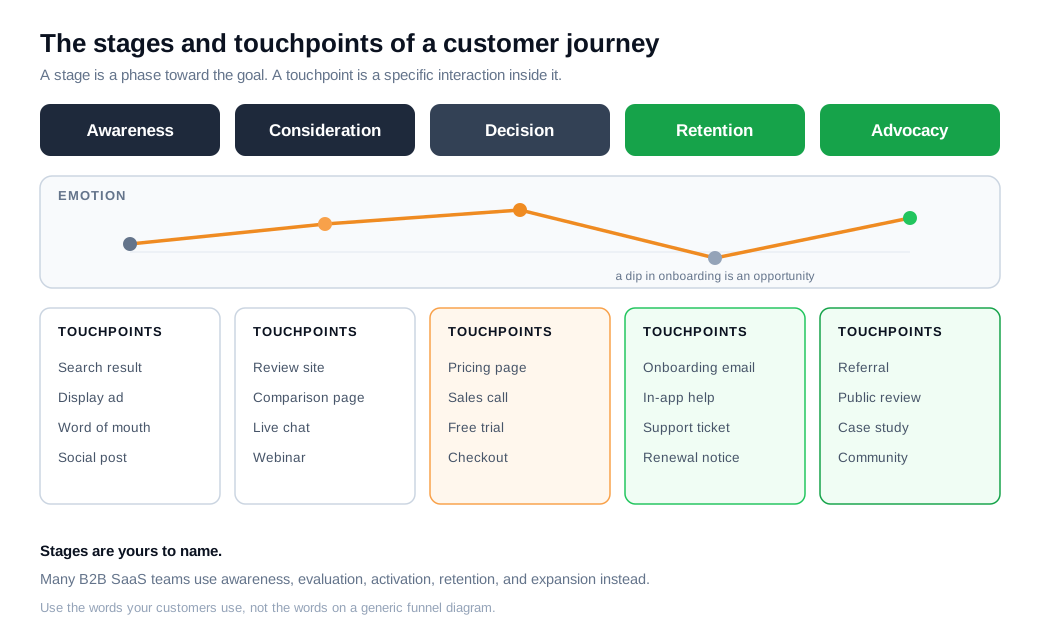
Each stage has a distinct job. In awareness, a person realizes they have a problem and first encounters you, maybe through an ad, a search result, or a colleague's recommendation. In consideration, they know you exist and weigh you against alternatives, reading reviews and comparison pages. In decision, they buy or sign up. Retention covers everything after the sale, the onboarding, the daily use, the support tickets, and advocacy is where a happy customer refers others or leaves a public review.
Touchpoints are the concrete interactions that populate those stages. A single journey can include a display ad, a G2 review, a pricing page, a sales call, a live chat session while the visitor is still deciding, an onboarding email sequence, a question answered by an AI chat assistant, a support ticket, and an invoice. Listing them per stage is what turns a vague funnel into an actual map, since it forces you to name every place the relationship can strengthen or snap.
One caution: the five-stage funnel is a starting template, not a law. Many B2B SaaS teams use awareness, evaluation, activation, retention, and expansion instead, because that language matches how their customers actually move. Name your stages after the goal your customer is chasing, and use the words they use, not the words your funnel diagram uses.
How do you build a customer journey map?
You build a customer journey map in a clear sequence: set an objective, pick one persona and one scenario, gather research, lay out the stages, fill the lanes with evidence, then mark the opportunities. Skipping the research step is the difference between a map of your customers and a map of your assumptions, which is why Zendesk and other CX teams put data collection at the center of the process.
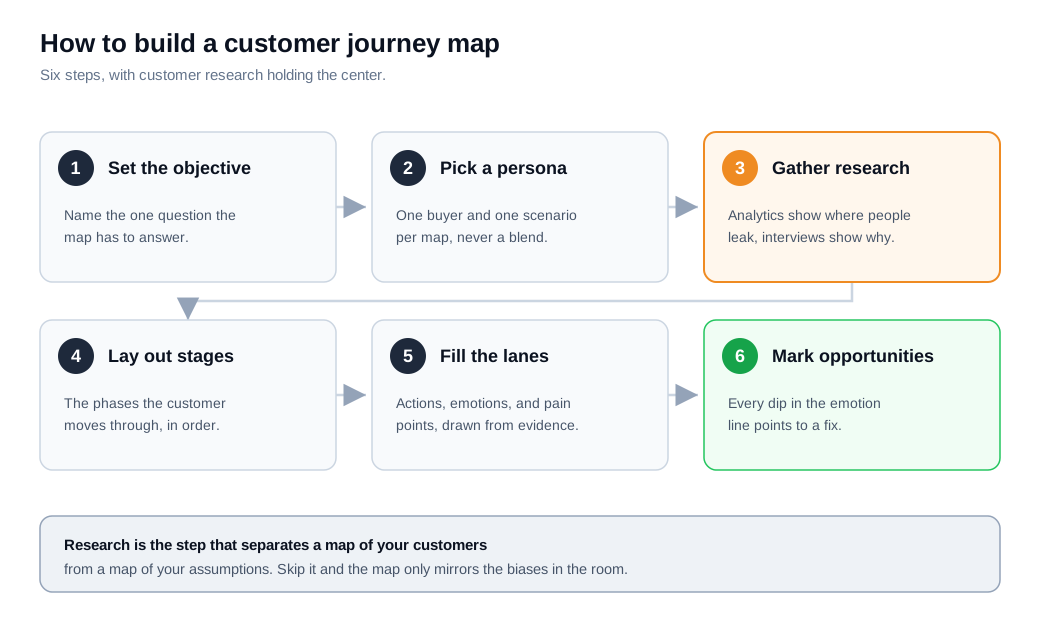
Start with a single, testable objective, such as understanding why free trials stall before activation. Then choose one persona and one scenario, because a map that mixes a first-time buyer with a renewing power user blurs into mush. Gather research from both sides: quantitative data (analytics, funnel drop-off, support ticket volume) shows where people leak out, and qualitative data (interviews, session recordings, survey verbatims) shows why. Qualtrics stresses that the emotions and pain points on the map should come from real customer input, not a workshop guess.
With research in hand, lay the stages across the top and fill the lanes underneath. For each stage, write the customer's actions, their thoughts, their emotion (a rising or falling point on the line), and the friction they hit. Where the emotion line dips and a pain point sits, you have found an opportunity, so mark it.
Here is a worked example. A B2B project-management tool, call it Meridian, wants to know why trials stall. It maps the trial-to-paid journey for one persona, a team lead evaluating tools for a five-person squad. Roughly 1,000 trials start each month. The emotion line runs high at sign-up (real hope), then drops hard during setup, where analytics show 40 percent of trials never invite a second teammate. The pain point is clear in the data: single-user trials convert to paid at about 6 percent, while trials with three or more active users convert at about 22 percent. The opportunity writes itself, prompt the trial user to invite their team on day one.
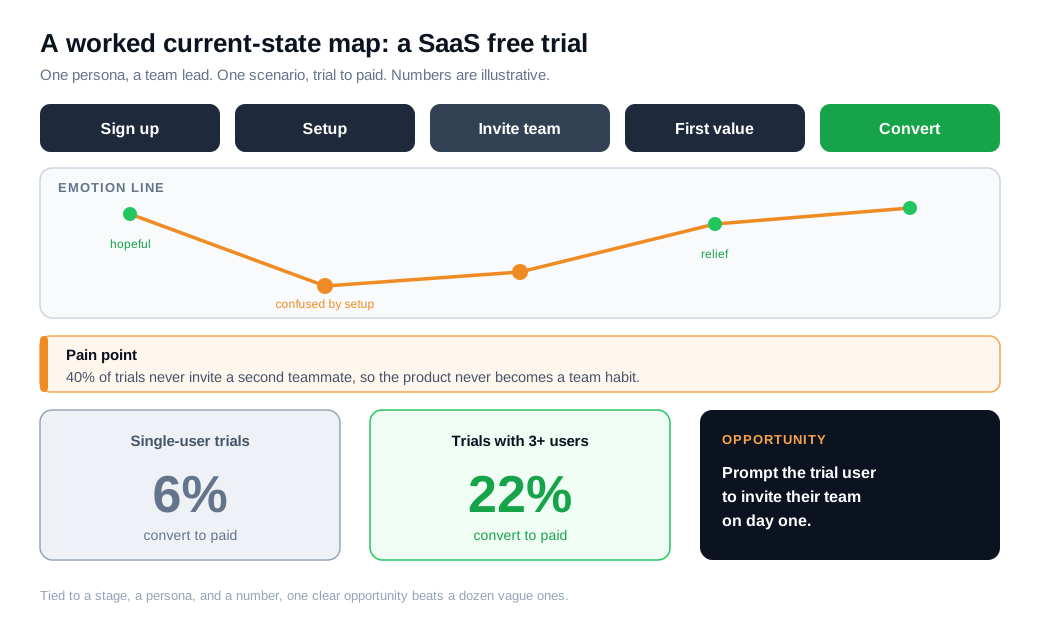
That single opportunity is worth more than a dozen vague ones, because it is tied to a stage, a persona, a number, and a clear next move. A good map produces a short list of findings like this, each anchored in evidence rather than opinion.
What are the different types of customer journey maps?
The main types are current-state, future-state, day-in-the-life, and service blueprint maps, and which one you reach for depends on whether you are diagnosing today's experience or designing tomorrow's. QuestionPro breaks the common types down by when to use each, and most CX projects start with a current-state map.
A current-state map shows how customers experience your product as it works right now, capturing the real touchpoints, emotions, and friction. It is the workhorse for finding what to fix, and the Meridian example above is a current-state map. A future-state map shows the ideal experience you are designing toward, which makes it the right tool when planning a redesign or a new onboarding flow.
A day-in-the-life map zooms out beyond your product to show how the customer's whole day is structured, which surfaces needs and constraints you would never see by mapping only your own touchpoints. A service blueprint goes the other direction and adds depth: it keeps the customer-facing frontstage but also draws the backstage systems, teams, and tools that make each touchpoint work, so you can trace a broken moment back to the process behind it. Pick the type that matches the question you are trying to answer, and resist the urge to cram all four into one crowded chart.
How do you use a customer journey map to improve customer experience?
You use a customer journey map to improve customer experience by turning its lowest emotional points and sharpest pain points into a ranked list of fixes, giving each fix an owner and a metric, then re-measuring the journey after you ship the change. A map that ends as a poster on the wall changes nothing, so the last step is always to convert findings into a prioritized backlog.
Rank the opportunities by impact and frequency. A pain point that hits every customer at a high-emotion moment beats a minor annoyance that affects a few, and the map makes that comparison visible because the emotion line and the pain-point lane are right next to each other. Return to Meridian: the onboarding dip is both high-frequency (40 percent of trials) and high-impact (a roughly four-fold conversion gap), so it goes to the top of the list. The team assigns it to product, ships an in-trial nudge to invite teammates, and adds a well-timed live chat prompt at the exact moment a solo user opens the sharing settings, then watches multi-user activation and trial-to-paid rate to see if the fix worked.
Two habits keep the map honest. First, build it from customer research, not internal opinion, because a confident-looking map drawn from assumptions mostly validates the biases already in the room, a trap Smaply lists among the most common journey mapping mistakes. Second, treat the map as a living document. Your product, pricing, and customers all move, so a map made once and filed away goes stale within a couple of releases and quietly starts to lie.
The map itself does not fix anything. It ranks the queue and shows where the experience breaks, and a team still has to own each fix, ship it, and check the result. Used that way, on a regular cadence rather than as a one-time offsite, a journey map gives an organization something rare: agreement on where the customer is actually struggling, and a shared reason to go fix it.
Key takeaways
- A customer journey map visualizes the full path a person takes to reach a goal with your company, laying stages across the top and lanes for actions, thoughts, emotions, and opportunities underneath, so scattered data becomes one shared picture.
- Journeys matter more than isolated touchpoints, with McKinsey finding journeys 30 to 40 percent more predictive of satisfaction, and redesigned journeys able to lift revenue 10 to 15 percent while cutting cost to serve 15 to 20 percent.
- Stages are the phases and touchpoints are the interactions inside them, with a common set running awareness, consideration, decision, retention, and advocacy, though B2B teams often rename them to match how customers really move.
- Build the map from research, one persona and one scenario at a time, using quantitative data to find where customers leak out and qualitative data to explain why, then mark every dip in the emotion line as an opportunity.
- Choose the map type that fits the question, a current-state map to diagnose today, a future-state map to design tomorrow, a day-in-the-life map for context, and a service blueprint when you need the backstage processes too.
- Turn the map into a ranked backlog with owners and metrics, fix the highest-impact dips first, re-measure after shipping, and keep the map alive so it does not drift out of sync with reality.

Written by
Nilas MylerCo-founder & CTO, Glimpze
Nilas is the co-founder and CTO of Glimpze, an inbound sales tool that turns high-intent website visitors into live conversations. A former SEO consultant for some of the largest companies in Denmark, he writes about speed-to-lead, inbound sales, and conversion rate optimization — the technical and operational mechanics of turning traffic into pipeline.


