
On this page
A customer who is about to leave rarely announces it. They log in a little less, open fewer tickets, skip the check-in call, and let the renewal date arrive with the decision already made. By the time the cancellation email lands, the account has been drifting for months.
Almost all of that drift shows up in data you already collect. The teams that keep their revenue are the ones that read the signals early, score them the same way every time, and reach the account while there is still time to turn it around.
This post covers what churn risk actually is, the signals that predict it, how a health score turns those signals into one number, how to build an early warning system that flags accounts before renewal, how to save the accounts that go red, and whether a rule-based score or a predictive model fits your team.
What is customer churn risk, and why catch it early?
Customer churn risk is the measurable likelihood that a customer will stop paying, and catching it early matters because saving an account costs far less than replacing it. The signals are usually present weeks or months before anyone cancels, so churn risk is less a surprise than a forecast you can choose to read.
The economics are what make early detection worth the effort. Acquiring a new customer costs five to 25 times more than retaining an existing one, and lifting retention by five percent can raise profits from 25 percent to 95 percent, figures Harvard Business Review traces back to Bain and Frederick Reichheld. A saved account also keeps compounding: it renews, it expands, and it refers. A lost one takes its future revenue with it and hands you an acquisition bill to stand still.
There is a timing dimension too. Warning signs for business software commonly appear 60 to 90 days before a cancellation, which is enough runway to act if you are watching, and not nearly enough if you find out at the renewal call. The whole point of identifying at-risk customers is to move the conversation forward from that final month, when your options have already narrowed to a discount.
What signals indicate churn risk?
The signals that indicate churn risk fall into four groups, product usage, engagement, sentiment, and commercial health, and the single strongest early signal is a drop in how often people use the product. Usage decline shows up before almost anything else because it reflects the customer voting with their behavior, not their words.
Product usage is where you look first. A falling login frequency is the most reliable predictor across nearly every subscription product, and analyses of churn indicators report that accounts logging in less than once a week tend to churn at markedly higher rates, while a sharp month-over-month drop in logins or core-feature use often precedes cancellation within the next couple of months, per LiveSession's rundown of churn indicators. Watch seat utilization against licenses too. An account paying for 50 seats and using 12 is telling you something.
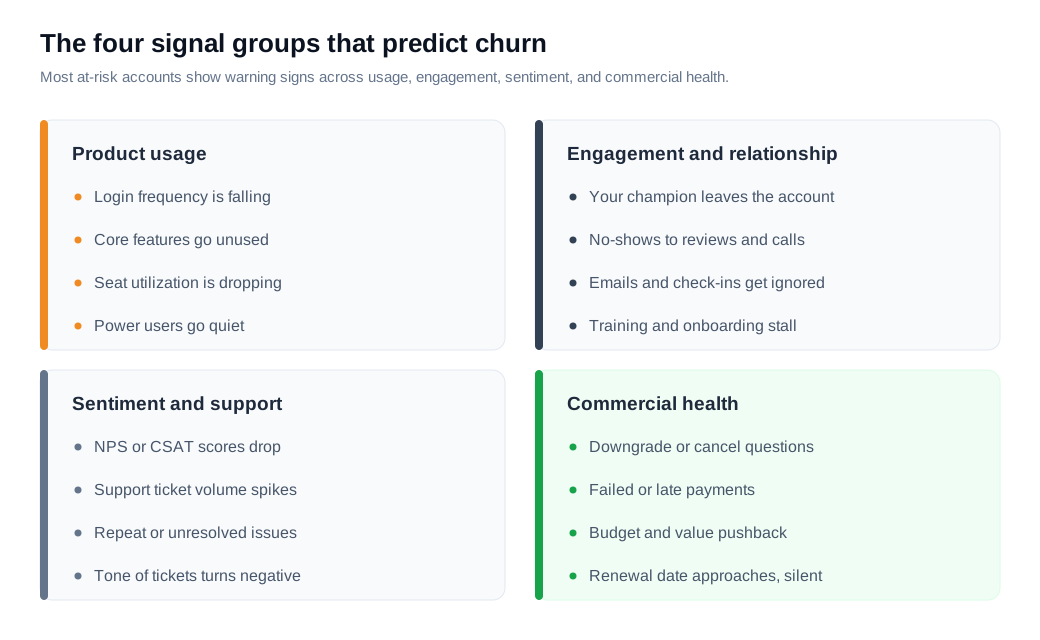
The other three groups round out the picture. Engagement signals cover the relationship: your internal champion leaves, invitations to reviews get declined, and emails go unanswered. Sentiment signals come from how the customer feels, so a dropping NPS or CSAT score, a spike in support tickets, or a run of repeat issues all raise the flag. Commercial signals are the bluntest, including downgrade requests, budget pushback, and failed or late payments that quietly signal a decision already forming.
No single signal is proof. A quiet month can be a vacation. What matters is the pattern: two or three signals moving the wrong way at once, on an account that used to look different. That combination is the real predictor, and it is exactly what a health score is built to capture.
How do health scores flag risk?
A customer health score flags risk by combining scattered signals into one number, usually on a 0 to 100 scale, that tells you at a glance whether an account is healthy, worth watching, or in trouble. It is a way to make thousands of accounts legible without a human staring at every dashboard, and to make "this account feels shaky" into something you can rank and act on.
Most models weight a handful of input categories and roll them into the score. A common structure weights product usage most heavily, then support, then sentiment, then executive engagement. Gainsight's guidance describes a representative split of roughly usage 40 percent, support 25 percent, sentiment 20 percent, and engagement 15 percent, with the reminder that the five most predictive metrics usually tell you more than 25 metrics thrown together. Pick the inputs that actually separated your churned accounts from your healthy ones, and drop the rest.
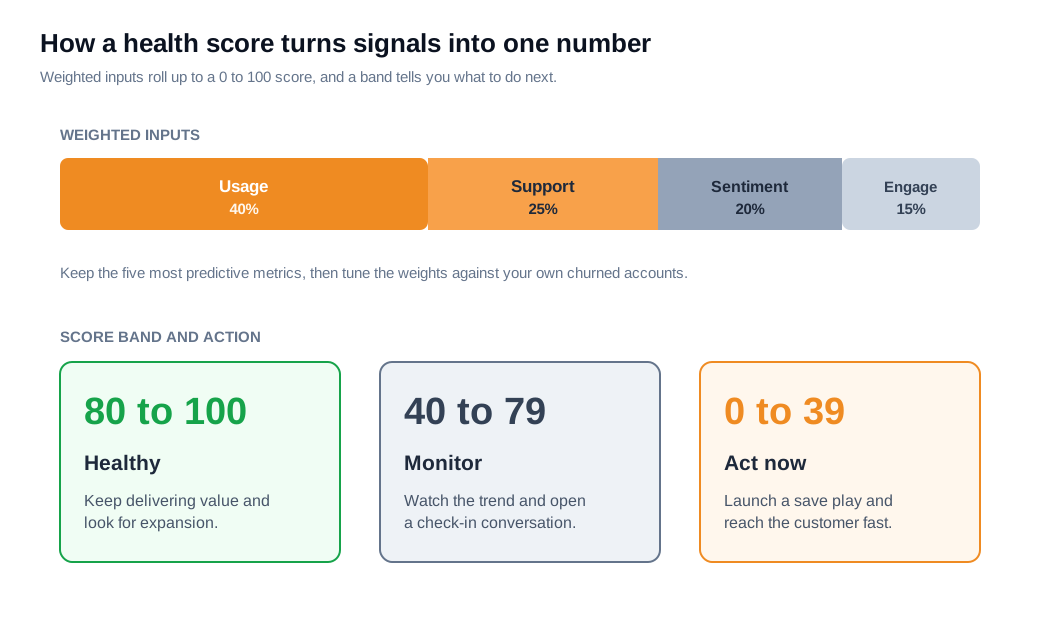
The score only earns its keep when it maps to action. Set clear bands so the number triggers a response: a common scheme treats 80 to 100 as healthy, 40 to 79 as monitor, and below 40 as act now. A score that nobody looks at until the quarterly review is decoration.
Two habits keep a health score honest. First, weight it against your own history rather than a generic template, since the metric that predicts churn for a self-serve product is rarely the one that predicts it for an enterprise deal. Second, retest it. Run the score against accounts that later churned and accounts that renewed, and tune the weights when it guesses wrong. A health score that has not been checked against real outcomes stays a hypothesis until the outcomes confirm it.
How do you build an early warning system?
You build an early warning system by defining the signals you will watch, setting risk thresholds, wiring alerts to a named owner, and giving each risk tier a prescribed play. The goal is that a slipping account produces an alert and an assigned action on its own, without waiting for someone to notice.
Start with the four steps in order:
- Choose the signals and their thresholds. Decide what counts as a warning. For example, a 30 percent month-over-month drop in logins, a support-ticket count above a set line, an NPS below 7, or a champion who has not logged in for 30 days. Write the numbers down so the system is consistent instead of relying on gut feel.
- Refresh the data often. A score that updates once a quarter finds risk after it is too late to act. Recompute at least daily, and ideally as events stream in, so a usage cliff shows up this week rather than at renewal. Detecting a risk signal even a few weeks before cancellation is what makes intervention possible at all.
- Route the alert to a person. An alert nobody owns is noise. Send it to the account owner in the tool they already live in, whether that is a customer success platform or a Slack notification through your integrations, and make one person responsible for the response. The mechanics of getting the right alert to the right rep are the same problem that lead routing and notifications solve on the sales side.
- Attach a play to each tier. A monitor-level flag might trigger an automated check-in or a proactive in-app nudge; a red flag triggers a human reaching out the same day. When the alert arrives with the next step already defined, the account gets handled instead of debated.
Automating the detection frees your team to spend its time on the response rather than the hunting. The system finds the account; the person saves it.
How do you save at-risk accounts?
You save an at-risk account by reaching the customer fast, diagnosing the real problem, and matching the effort to the severity, and the single biggest lever is how early you start. The same account is far more persuadable three months out than in its final week, when the internal decision has usually hardened.
The timing effect is large enough to plan around. One 2026 at-risk playbook reports that save rates run near 58 percent when intervention begins more than 90 days before renewal, fall to about 34 percent inside the 60-day window, and drop under 18 percent in the final 30 days. Put money on those percentages and the case for early detection stops being abstract.
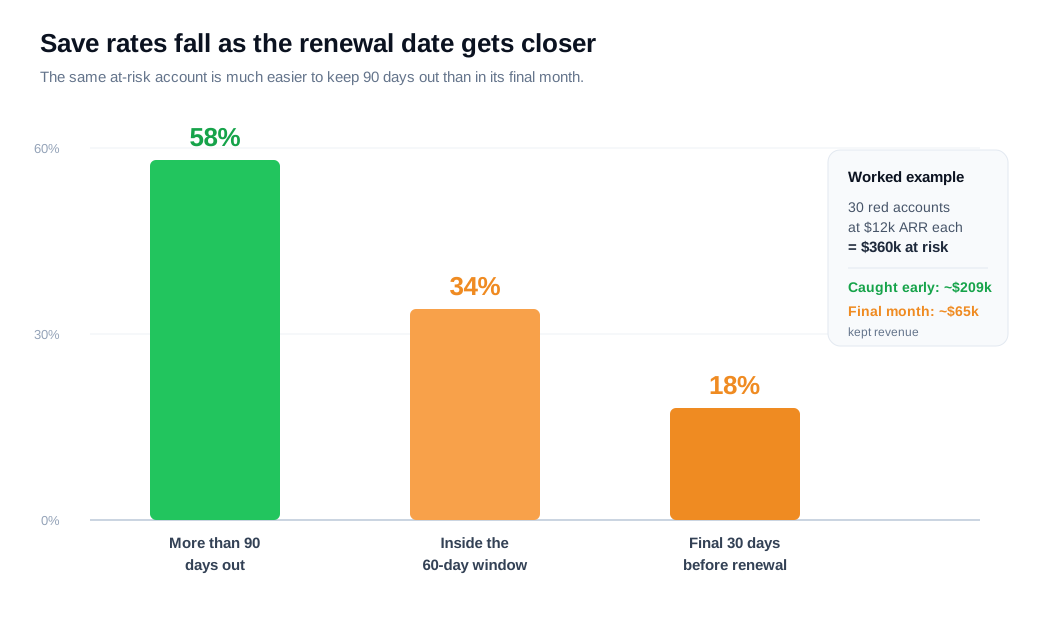
Here is the worked example. Say your early warning system flags 30 accounts as red this quarter, each worth $12,000 in annual recurring revenue, so $360,000 of revenue is on the line. Work those accounts while they are still more than 90 days from renewal at a 58 percent save rate and you keep roughly 17 of them, about $209,000. Wait until the final month, where the save rate is 18 percent, and you keep about 5 accounts, roughly $65,000. Same accounts, same team, a $144,000 swing that comes entirely from when you started.
Match the intervention to the tier. A monitor-level account often just needs a nudge back to value: a proactive message when usage dips, a short guide to the feature they never adopted, or an AI chat assistant that answers the routine question at the moment they get stuck so it never becomes a ticket. Catching the dip in the moment is what proactive outreach is for. A red account needs a human and a real conversation, fast. Reaching out over live chat while the customer is still in the product, and moving to a call or screen share when the issue is easier to show than to type, turns a slow email thread into a same-day fix. For the largest or most strategic accounts, bring in an executive sponsor and be ready to discuss the concrete change that will keep them, whether that is a workflow fix, added training, or a commercial adjustment.
Whatever you offer, diagnose before you discount. A price cut aimed at a customer whose real problem is a missing integration buys you a smaller loss rather than a save. Ask what changed, fix that, and confirm the account has climbed back into a healthy band and stayed there before you call it saved.
Should you use a manual health score or a predictive model?
Start with a manual, rule-based health score, and add a predictive model once you have enough clean history and churn events to train one. A weighted score you can explain in a sentence ships this month and gets your team acting on risk; a machine learning model earns its complexity later, when the simple version stops keeping up.
Each approach has a clear trade-off. A rule-based score is transparent, fast to build, and easy to adjust, but it leans on lagging indicators and human judgment about which signals matter. A predictive model can find patterns across hundreds of variables that no analyst would spot, and vendors report AI-driven health scores predicting churn several months ahead once trained on enough data, though the field is still moving from static scores toward these predictive systems and adoption is far from universal. The catch is that a model needs volume, clean data, and labeled churn outcomes, and it can turn into a black box your CSMs do not trust.
For most teams the honest answer is a sequence. Ship the rule-based score, use it to build the habit of acting on risk, and let it generate the labeled history a model will need. Retention pays for the work either way: reaching net revenue retention above 100 percent, which benchmark data still treats as the mark of a healthy subscription business, depends far more on catching and saving at-risk accounts than on the sophistication of the algorithm that flags them.
Key takeaways
- Churn risk is a forecast, not a surprise. The signals usually appear 60 to 90 days before a cancellation, and retention economics make catching them early one of the highest-return moves a customer success team has.
- Watch four signal groups, and weight usage first. Product usage, engagement, sentiment, and commercial health together tell the story, and a falling login frequency is the strongest early warning across most subscription products.
- A health score is only useful when it maps to action. Combine weighted signals into a 0 to 100 number, set bands like healthy, monitor, and act now, and retest the weights against accounts that actually churned.
- An early warning system needs owners and plays. Define thresholds, refresh the data at least daily, route each alert to a named person, and attach a prescribed response to every risk tier.
- Start early and match effort to severity. Save rates fall sharply as renewal approaches, so a red account caught 90 days out is worth several caught in the final month, and diagnosing the real problem beats reflexively discounting.
- Ship the simple score first, add prediction later. A transparent rule-based score gets your team acting now and generates the history a predictive model will eventually need.

Written by
Nilas MylerCo-founder & CTO, Glimpze
Nilas is the co-founder and CTO of Glimpze, an inbound sales tool that turns high-intent website visitors into live conversations. A former SEO consultant for some of the largest companies in Denmark, he writes about speed-to-lead, inbound sales, and conversion rate optimization — the technical and operational mechanics of turning traffic into pipeline.


