On this page
- What is the SaaS quick ratio?
- How do you calculate the SaaS quick ratio?
- What does the SaaS quick ratio reveal about growth quality?
- What is a healthy SaaS quick ratio?
- How is the SaaS quick ratio different from the accounting quick ratio?
- What does the SaaS quick ratio hide?
- How do you improve your SaaS quick ratio?
- Key takeaways
- Sources
Two SaaS companies each report 20% month-over-month growth in recurring revenue. On a board slide they look like the same business. Underneath, one is compounding on a base of customers who keep paying and buying more, and the other is pouring new sales into a bucket that leaks almost as fast as it fills.
The metric that tells them apart is the SaaS quick ratio. It ignores the headline growth rate and asks a blunter question: for every dollar of recurring revenue you lose, how many do you add? The answer separates growth you can bank from growth you have to keep buying.
This post covers what the SaaS quick ratio is, how to calculate it, what it reveals about the quality of your growth, what a healthy number looks like, how it differs from the accounting quick ratio, what it hides, and the levers that move it.
What is the SaaS quick ratio?
The SaaS quick ratio measures how efficiently a subscription business grows by dividing the recurring revenue it gains in a period against the recurring revenue it loses in that same period. A ratio of 4 means the company adds four dollars of recurring revenue for every dollar it gives back to churn and downgrades.
The metric was popularized by venture capitalist Mamoon Hamid, then at Social Capital, who introduced it at an early SaaStr conference in 2015 and said publicly that he looked for a quick ratio of 4 before he would fund a SaaS company. His point was that a headline growth rate can flatter a business. Two companies can both post 20% monthly growth in monthly recurring revenue (MRR), yet one keeps almost every customer it wins while the other loses them nearly as fast.
The quick ratio takes that ambiguity out. It treats growth as a flow with two directions: revenue coming in from new customers and expansions, and revenue going out through cancellations and downgrades. A high number says the inflow dominates, which usually points to strong product-market fit and an efficient go-to-market motion. A low number exposes what founders call the leaky bucket, where new sales mostly refill revenue that existing customers are draining away.
How do you calculate the SaaS quick ratio?
You calculate the SaaS quick ratio by adding new MRR and expansion MRR, then dividing that sum by the total of churned MRR and contraction MRR for the same period. Written out, the formula is:
Quick ratio = (New MRR + Expansion MRR) / (Churned MRR + Contraction MRR).
Each term is one type of movement in your recurring revenue over the month (some teams run it on ARR instead, but a monthly cut is most common):
- New MRR is recurring revenue from customers who signed up during the period.
- Expansion MRR is added recurring revenue from existing customers who upgraded, added seats, or bought more.
- Churned MRR is recurring revenue lost from customers who cancelled entirely.
- Contraction MRR is recurring revenue lost from customers who stayed but downgraded.
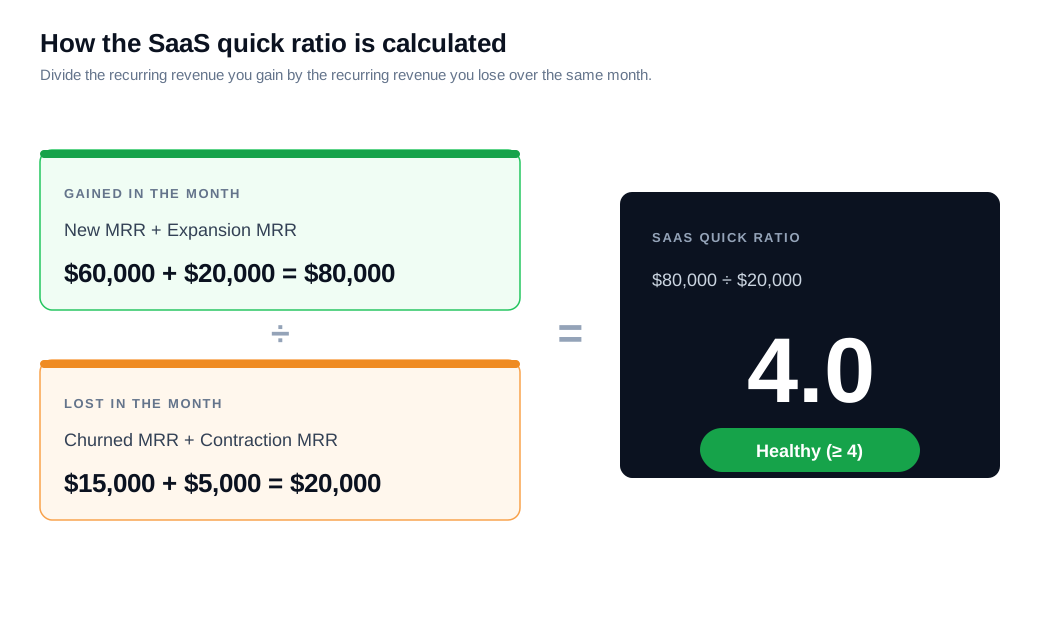
Work an example. In March, a SaaS company books $60,000 of new MRR and $20,000 of expansion MRR, so it gains $80,000. In the same month it loses $15,000 to full cancellations and $5,000 to downgrades, for $20,000 lost. The quick ratio is $80,000 divided by $20,000, which is 4.0. Its net new MRR for the month is $80,000 minus $20,000, or $60,000, and the ratio tells you that net figure came from adding far more than it lost rather than from a frantic race to stay ahead of churn.
Two habits keep the number honest. Measure all four movements over the same window, and count each customer once, so a customer who upgrades and later downgrades in the same month nets out instead of inflating both sides.
What does the SaaS quick ratio reveal about growth quality?
The SaaS quick ratio reveals whether your growth is durable or borrowed, because it shows how much of every gain survives after churn and contraction take their cut. A company can reach an impressive growth rate two ways: by keeping most of what it wins, or by winning enormous amounts to paper over heavy losses. The ratio tells those apart, which a growth rate on its own cannot.
Consider two companies that both land at a quick ratio of 4.0.
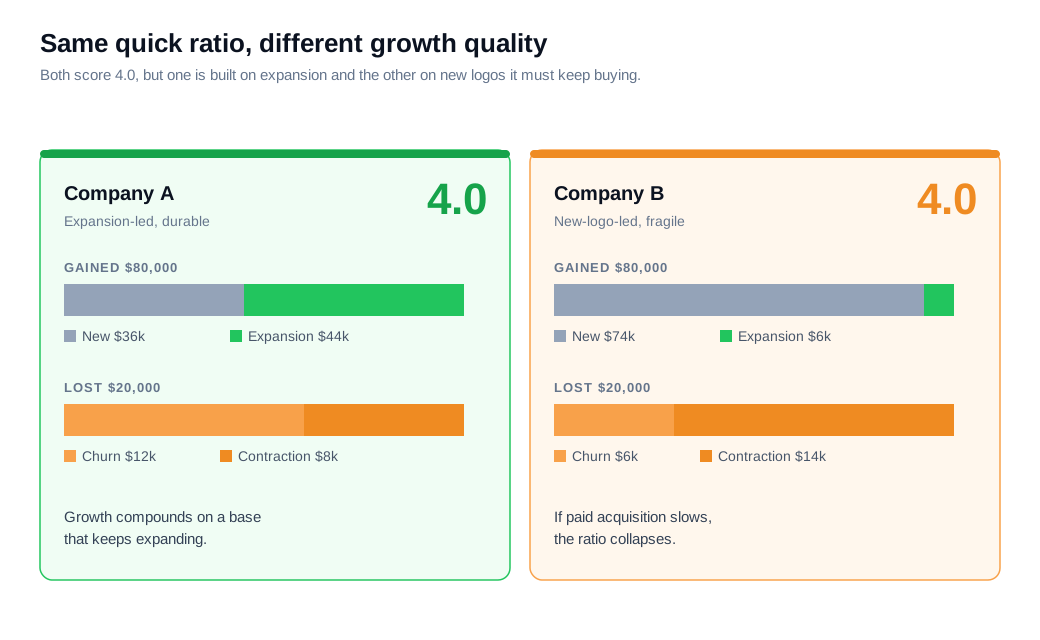
Company A adds $80,000 of MRR in the month, and $44,000 of that comes from existing customers expanding. Its losses are modest and skew toward outright cancellations it can study and fix. Company B adds the same $80,000, but $74,000 of it is brand-new logos, while its existing base is quietly contracting. Both print a 4.0. A's growth compounds on a base that is getting more valuable. B's depends on keeping the new-logo machine running at full speed, and the day acquisition slows, its ratio falls through the floor.
This is also why a target quick ratio has to be read next to the growth rate behind it. Tomasz Tunguz has shown that the churn a company can absorb while still hitting a quick ratio of 4 rises with its growth rate, so a fast grower and a slow grower reporting the same ratio are tolerating very different amounts of leakage underneath. The ratio is a strong signal of quality, and the signal sharpens when you look at what is feeding it.
What is a healthy SaaS quick ratio?
A SaaS quick ratio of 4 or higher is the widely cited healthy benchmark, meaning you add at least four dollars of recurring revenue for every dollar you lose. It traces directly to Hamid's investing rule, and it has stuck as industry shorthand for efficient growth.
The full scale is more useful than the single line.
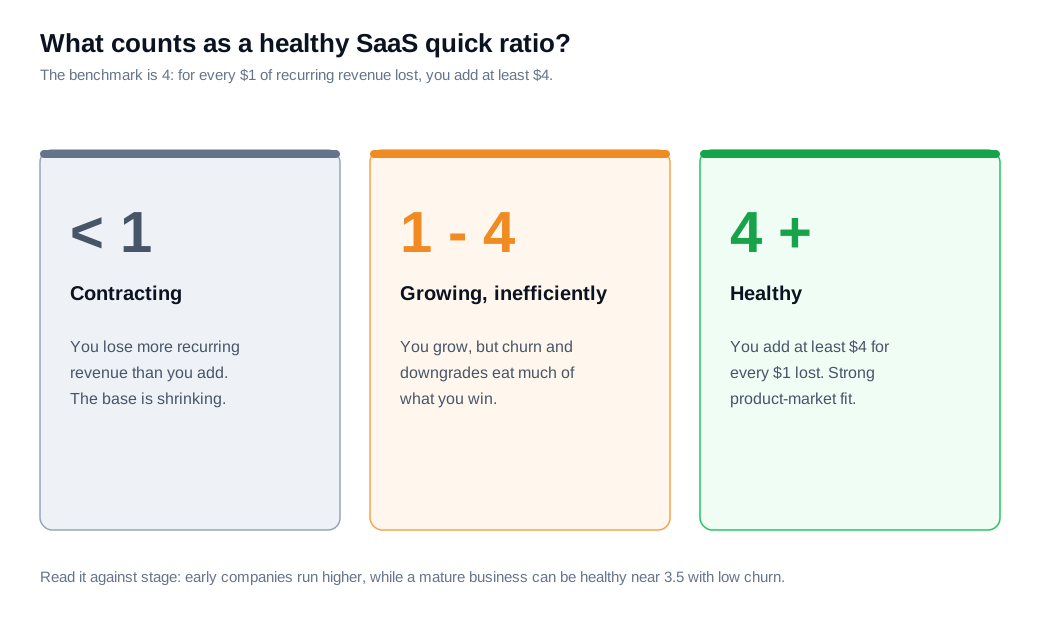
Below 1, you are losing more recurring revenue than you add and the base is shrinking, which is a signal to fix retention before spending another dollar on acquisition. Between 1 and 4 you are growing, but churn and downgrades are eating a large share of what you win, so you are working harder than you should to move the top line. At 4 and above, the inflow clearly dominates the outflow, and growth looks efficient.
Stage and scale bend the benchmark. Early-stage companies often post quick ratios well above 4 simply because they have few customers and little accumulated churn to drag on them, so a startup at 8 is less impressive than it sounds. A mature company at $30 million ARR with a large installed base is fighting far more gross churn in absolute dollars, and a ratio of 3.5 built on low churn and strong net revenue retention can be healthier than a 5 propped up by discount-driven new logos. Read the number against the company's size and age rather than as a universal pass or fail.
How is the SaaS quick ratio different from the accounting quick ratio?
The SaaS quick ratio and the accounting quick ratio share a name but measure completely different things, so it pays to keep them straight. The accounting quick ratio, also called the acid-test ratio, is a liquidity measure. It divides a company's most liquid current assets (cash, marketable securities, and receivables, but not inventory) by its current liabilities to ask whether the business could cover its short-term bills right now.
The SaaS quick ratio has nothing to do with the balance sheet or liquidity. It looks only at the movement of recurring revenue and asks how efficiently that revenue is growing. One answers "can we pay what we owe this quarter," the other answers "is our subscription growth built to last." A finance team can quote both about the same company, and they can point in opposite directions.
The only overlap is the word "quick," borrowed because both compare something flowing in against something flowing out. When an investor asks a SaaS founder for their quick ratio, they almost always mean the growth-efficiency version, though it is worth confirming which one, especially in a room that mixes operators and accountants.
What does the SaaS quick ratio hide?
The SaaS quick ratio hides the mix behind the number, because it collapses four very different revenue movements into a single figure. A 4.0 built mostly on expansion from happy customers and a 4.0 built mostly on heavily discounted new logos read identically, even though one is far more durable, which is why investors at Series A and beyond increasingly ask for a decomposition of the ratio rather than the headline alone.
It is also silent on cost. The quick ratio counts the revenue you add but says nothing about what you spent to add it, so a company buying its numerator with unsustainable ad spend can look healthy right up until the budget tightens. Pairing the ratio with customer acquisition cost and the LTV to CAC ratio closes that gap.
Two more blind spots are worth naming. The ratio is noisy over short windows, so a single large enterprise deal or one big cancellation can swing a month without signaling a trend, which is why most teams watch it as a trailing average. And it overlaps with, but does not replace, net revenue retention. NRR isolates how the existing customer base behaves, while the quick ratio blends that base with new-logo growth, so the two answer related but separate questions and are strongest read together. Treat the quick ratio as a fast read on growth efficiency, then look underneath it before drawing conclusions.
How do you improve your SaaS quick ratio?
You improve the SaaS quick ratio by raising the numerator (new and expansion MRR) or shrinking the denominator (churned and contraction MRR), and cutting churn usually does the most work because it acts on the smaller number. Since you divide by losses, every dollar of recurring revenue you keep improves the ratio more than a dollar you add.
Start with the denominator. Reducing cancellations and downgrades through better onboarding, faster support, and fixing the reasons customers leave shrinks the number you divide by, and because that number is small, keeping a few dollars moves the ratio a lot. In the worked example, holding gains at $80,000 while cutting losses from $20,000 to $13,000 moves the ratio from 4.0 to about 6.2 without a single extra sale.
Expansion is the cheapest way to lift the numerator. Upsells, added seats, and plan upgrades bring in recurring revenue at close to zero acquisition cost, and because expansion signals a healthy base, it improves the quality of the ratio and not only its level.
New MRR is the other half, and the fastest gains there usually come from converting more of the traffic you already pay for rather than buying more of it. A large share of new-logo budget brings visitors who land, hesitate, and leave without ever talking to anyone. Reaching high-intent visitors while they are still on the page, with live chat or a quick call when a question is easier to show than to type, turns more of that existing traffic into new MRR, which lifts the numerator without inflating acquisition cost. Building that speed-to-lead habit into an inbound sales motion tends to raise the quality of the numerator too, since customers who got a fast, helpful answer up front churn less later.
Put the levers on the example together. Sharpen the funnel so new MRR rises from $60,000 to $70,000, add $25,000 of expansion instead of $20,000, and cut losses from $20,000 to $14,000. Gains become $95,000, losses become $14,000, and the quick ratio climbs from 4.0 to roughly 6.8. The growth rate barely moved. What changed is how much of that growth the company gets to keep.
Key takeaways
- The quick ratio is growth efficiency in one number. Divide new plus expansion MRR by churned plus contraction MRR, and a result of 4 means you add four dollars of recurring revenue for every dollar you lose.
- Calculate all four movements over the same window. New and expansion MRR make up the gains, churned and contraction MRR make up the losses, and mixing periods or double-counting a customer distorts the ratio.
- It exposes growth quality a growth rate hides. Two companies with identical MRR growth can post very different quick ratios, because the metric shows how much of each gain survives churn.
- 4 or higher is the healthy benchmark, with context. Below 1 the base is shrinking and 1 to 4 is inefficient growth, but early-stage companies run higher and mature ones can be healthy below 4 with strong retention.
- Do not confuse it with the accounting quick ratio. The acid-test ratio measures short-term liquidity from the balance sheet, while the SaaS quick ratio measures recurring-revenue growth efficiency.
- Cut churn first to move it. Because you divide by losses, keeping revenue lifts the ratio more than adding it, and cheaper conversion and expansion handle the numerator.
TAGS

Written by
Daniel SemeckyCo-founder & CEO
Daniel is the co-founder and CEO of Glimpze. He spends his days talking to revenue teams about how to catch high-intent visitors before they bounce, and writes about inbound sales, lead conversion, and building a motion where marketing and sales actually share a number.