On this page
A SaaS company can add users every month and still watch revenue growth flatten. The reason is usually hiding in a single number: average revenue per user.
ARPU tells you how much money each customer brings in, on average, over a set period. When it climbs, every dollar you spend on acquisition works harder. When it slips, you have to run faster just to hold the same revenue line.
This guide covers what ARPU means, how to calculate it, how it differs from ARPA and ARPPU, what pushes it up or down, the levers that raise it, and what a healthy benchmark looks like.
What is average revenue per user?
Average revenue per user (ARPU) is the average amount of revenue a business earns from each customer over a defined period, usually a month, quarter, or year. The metric started in telecom, where carriers used it to compare revenue across huge subscriber bases, and it has become a standard way for subscription and SaaS companies to gauge how well they monetize the customers they already have.
The value of ARPU is that it normalizes revenue against your user count. Total revenue can rise simply because you added more logos, which hides whether each account is actually worth more. ARPU strips that out. It answers a narrower question: on average, how much is one customer worth to us right now?
Because it is a single ratio, ARPU travels well. You can track it over time to see whether monetization is improving, compare it across pricing tiers, or use it as an input to bigger models like lifetime value. Stripe frames it as a direct read on how effectively a business converts its user base into revenue, and that framing is why finance and growth teams watch it so closely.
How do you calculate ARPU?
You calculate ARPU by dividing total revenue for a period by the number of active users in that same period. For a subscription business, the cleanest version uses recurring revenue: divide monthly recurring revenue (MRR) by the count of active subscribers to get monthly ARPU, or divide annual recurring revenue (ARR) by subscribers for the annual figure.
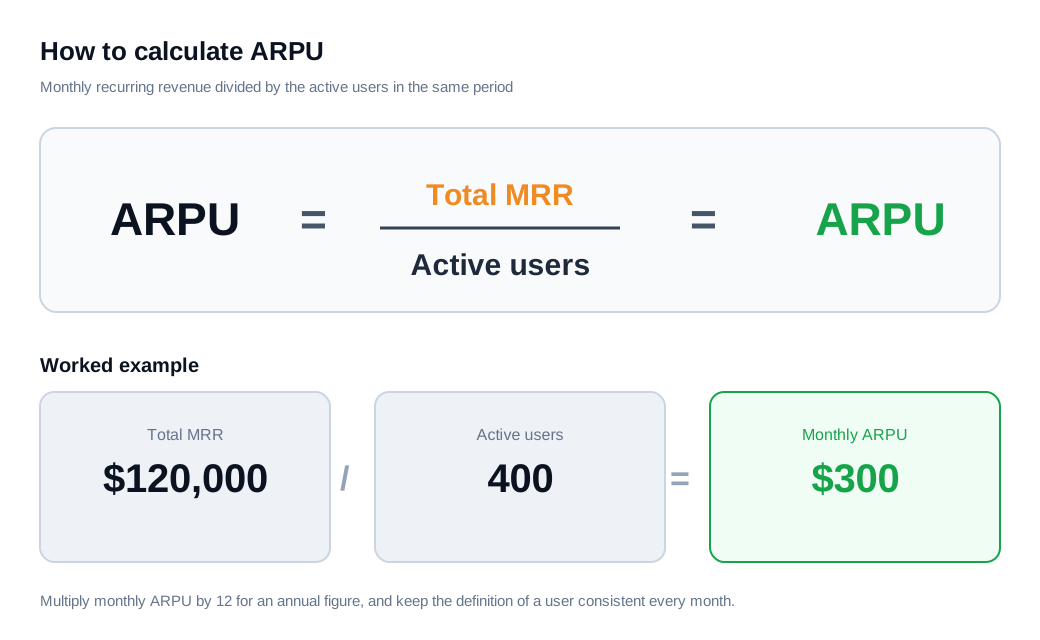
Here is a worked example. Say your product generates $120,000 in MRR this month across 400 active accounts. Divide $120,000 by 400 and you get an ARPU of $300 per month. If you prefer an annual view, multiply that by 12 for $3,600, or run the same division on your ARR directly.
Two details matter more than the arithmetic. First, be consistent about what counts as a user. Some teams measure per individual seat, others per billing account, and mixing the two across months will make ARPU jump for reasons that have nothing to do with monetization. Second, decide up front whether free users belong in the denominator. If you have a large free tier, including those accounts drags ARPU down and can mask how much your paying customers actually spend. HubSpot and Baremetrics both stress picking one definition and holding it steady so the trend line stays honest.
What is the difference between ARPU, ARPA, and ARPPU?
ARPU, ARPA, and ARPPU all measure revenue efficiency, but they divide revenue by different denominators, and the right one depends on how you sell. Picking the wrong denominator is the most common way teams end up comparing numbers that do not mean the same thing.
ARPU divides revenue by users or seats, which fits products billed per person. ARPA, average revenue per account, divides revenue by accounts, so a 50-seat company counts as one account. ChartMogul notes that ARPA is usually the cleaner planning metric for B2B SaaS because billing happens at the account level, and one customer can hold many users. ARPPU, average revenue per paying user, excludes free accounts entirely and looks only at customers who pay.
A quick example shows why the gap matters. Suppose you have 1,000 total users, but only 250 of them pay, and paying users generate $25,000 in MRR. Your ARPU across all users is $25,000 divided by 1,000, or $25. Your ARPPU is $25,000 divided by 250, or $100. Same revenue, very different story. If your model runs on a freemium funnel, ARPPU tells you whether the paying core is healthy while ARPU tells you how well the free base converts.
Why does ARPU matter, and how does it connect to LTV?
ARPU matters because it feeds directly into lifetime value, payback period, and the unit economics that decide whether growth is profitable. On its own, ARPU is a snapshot. Its real power shows up when you multiply it out across the time a customer stays with you.
The common SaaS formula for lifetime value is ARPU multiplied by gross margin, divided by your churn rate. Suppose ARPU is $300 per month, gross margin is 80 percent, and monthly churn is 3 percent. Lifetime value works out to ($300 times 0.80) divided by 0.03, which is $240 divided by 0.03, or $8,000 per customer. Now compare that to acquisition cost. If it costs $2,500 to win that customer, your LTV to CAC ratio is 3.2 to 1, which sits right at the 3 to 1 mark that many investors treat as a healthy floor.
Notice what happens when ARPU moves. Lift ARPU from $300 to $360 and hold the other inputs steady, and lifetime value rises to $9,600, pushing the same acquisition spend to a 3.8 to 1 return. That leverage is why teams chasing better unit economics often find the fastest gains in ARPU rather than in cutting acquisition cost. Higher ARPU also shortens payback, since each customer returns their acquisition cost in fewer months.
What drives ARPU up or down?
ARPU moves whenever revenue and user count grow at different rates, and the biggest drivers are pricing, plan mix, expansion, and the kind of customer you attract. It is less a lever you pull directly and more the output of several decisions upstream.
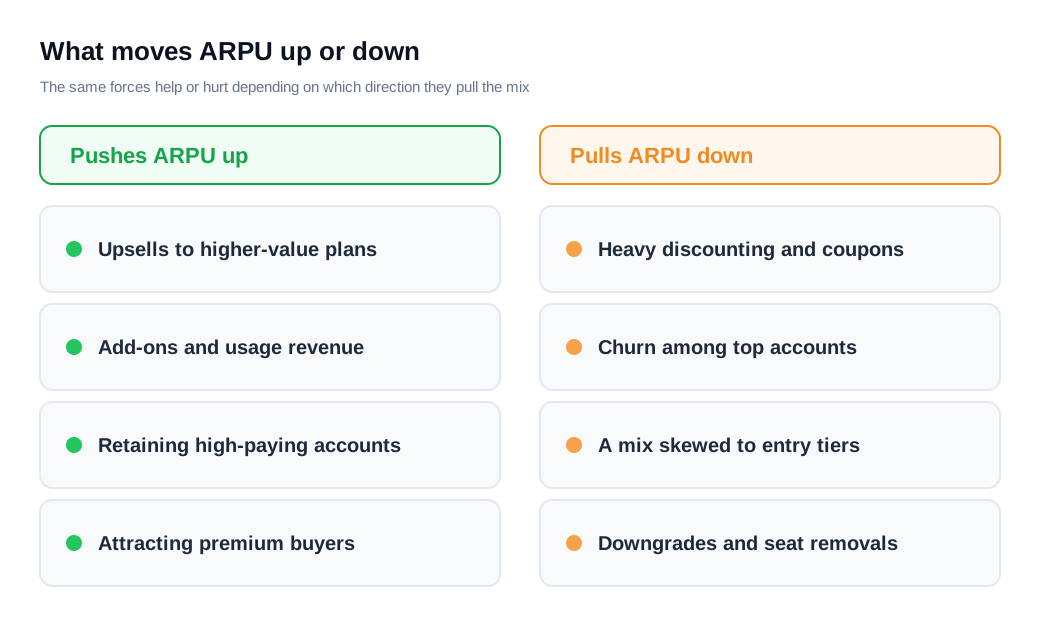
Plan mix is the quiet force behind most ARPU shifts. When new signups skew toward your cheapest tier, ARPU drifts down even if every plan price stays the same. When customers upgrade or when you win more enterprise logos, it drifts up. Discounting works the same way in reverse: aggressive coupons and deals often lift conversion in the short term, but they pull the mix toward cheaper subscriptions and can erode ARPU once the promotion wears off.
Churn also moves ARPU, and not evenly. Losing a high-paying account drops ARPU more sharply than losing a small one, because you remove more revenue from the numerator than you remove accounts from the denominator. The reverse is true for expansion. Add-ons, extra seats, and usage-based charges layer revenue on top of the base subscription without adding a new account, so they raise ARPU directly. Buyer quality sits underneath all of it. A base skewed toward serious, high-intent buyers will carry a higher ARPU than one filled with tire-kickers who never leave the entry tier.
How do you increase ARPU?
You increase ARPU by raising the revenue each customer generates without losing more customers than the gains are worth, and there are five reliable levers to pull. None of them require adding a single new logo, which is what makes ARPU such an efficient growth lever.
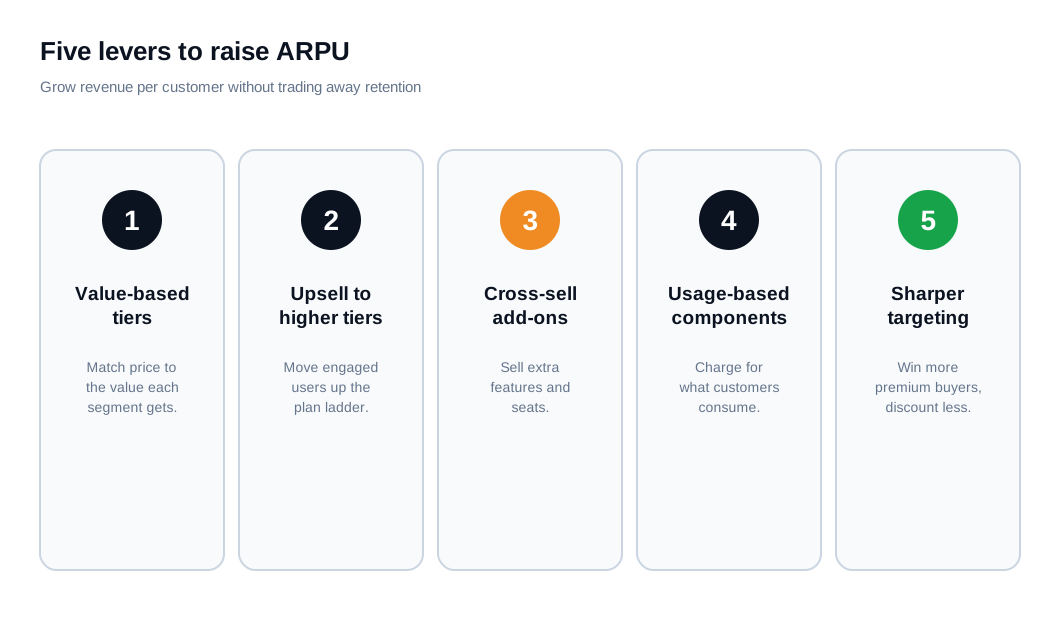
The first lever is value-based tiers. Structure your plans so price rises with the value each segment actually gets, and put the features power users need on the plans they can grow into. The second is upselling active users to higher tiers, ideally triggered by real usage signals, so the customer feels the ceiling of their current plan before you ask them to move. The third is cross-selling complementary add-ons and extra seats, which expands revenue inside accounts that already trust you. Paddle groups these expansion motions together and points out that they lift lifetime value and cut net revenue churn at the same time.
The fourth lever is a usage-based component that charges for consumption as customers scale, so your revenue tracks the value they draw from the product. The fifth is sharper targeting, which means aiming acquisition at higher-value buyers and leaning less on deep discounts that fill the base with low-ARPU accounts. This is where earlier conversations pay off. When a high-intent visitor is comparing plans, catching them with live chat or a quick call lets a rep steer them toward the tier that fits, rather than defaulting to the cheapest option. Teams focused on inbound sales often find that the same speed-to-lead motion that wins the deal also lands a larger initial contract, which raises ARPU from day one.
Here is a worked example of the payoff. Start with 400 accounts at $300 ARPU, or $120,000 in MRR. Move just 20 percent of them, 80 accounts, up to a plan worth $150 more per month. That adds $12,000 in MRR with no new customers, lifting ARPU from $300 to $330. The same 10 percent lift applied through a usage add-on or a price update compounds on top of it.
What counts as a good ARPU benchmark?
A good ARPU depends entirely on your market, because a self-serve tool and an enterprise platform live in different worlds. There is no universal target, and chasing someone else's absolute number will lead you astray more often than it helps.
The pattern that holds across benchmarks is that ARPU scales with the customer you sell to. Products aimed at individuals or small teams tend to sit at the low end, while enterprise-focused platforms report ARPU several times higher, driven by larger seat counts, premium tiers, and negotiated contracts. Chargebee and Paddle both make the same practical point: your own trend line is the benchmark that matters most. An ARPU that climbs quarter over quarter, while retention holds, signals that your monetization is improving faster than any comparison to a competitor can tell you.
Watch ARPU alongside churn and conversion rather than in isolation. An ARPU that spikes because you priced out smaller customers is not the same win as one that grows through expansion, and only the second kind is durable. Segment it too. Reading ARPU by tier, channel, or cohort will show you exactly where the high-value customers come from, which is the input you need to pull the levers above with any precision.
Key takeaways
- ARPU is revenue per customer over a period, calculated as total recurring revenue divided by active users, and it shows how well you monetize the base you already have.
- The denominator defines the metric, so keep the definition of a user consistent and decide up front whether free accounts and non-payers belong in the count.
- ARPU drives lifetime value, since LTV equals ARPU times gross margin divided by churn, which means small ARPU gains compound into large unit-economics gains.
- Plan mix, discounting, and churn move ARPU more than list prices do, so watch where new signups land and which accounts you lose.
- Five levers raise ARPU: value-based tiers, upsells, cross-sells, usage-based pricing, and sharper targeting of higher-value buyers.
- Your own trend is the benchmark, so track ARPU by segment alongside churn and conversion instead of chasing another company's absolute number.
TAGS

Written by
Daniel SemeckyCo-founder & CEO
Daniel is the co-founder and CEO of Glimpze. He spends his days talking to revenue teams about how to catch high-intent visitors before they bounce, and writes about inbound sales, lead conversion, and building a motion where marketing and sales actually share a number.