On this page
Two SaaS companies sign the same number of new customers this year and spend the same to get them. One grows 60 percent, the other 35 percent. The gap traces back to what happened inside the base they already had: how much each existing customer grew, or shrank, over the twelve months.
That growth inside the base has a name, expansion revenue, and once a company reaches scale it becomes the largest single source of new revenue it has. It is also the cheapest source, because you are selling more to people who already pay you and already trust the product.
This post covers what expansion revenue is, where it comes from, how to calculate it, how it drives net revenue retention, why it costs so much less than winning new logos, and the plays that actually move it.
What is expansion revenue?
Expansion revenue is the additional recurring revenue you earn from existing customers over a period, on top of what they already paid you, through upsells, cross-sells, added seats or usage, and price increases. It counts only the growth that happens inside your current base, so a brand-new customer signing this month never shows up in the number.
Paddle defines expansion MRR as the sum of monthly recurring revenue gained from upsells, cross-sells, seat expansion, and price increases within your current customer base during a given period. Measured annually the same idea is called expansion ARR. Either way, the metric answers one question: how much more did the customers we already had decide to spend with us.
Two boundaries keep the number clean. A customer who simply renews at the same price adds no expansion, because renewal holds revenue rather than growing it. And revenue from a new logo, even one that closed the same day, belongs to new business rather than expansion. Expansion is the middle ground where an existing relationship gets larger.
What are the main sources of expansion revenue?
Expansion revenue comes from four repeatable sources: upsells to a higher tier, cross-sells of a separate product, seat or usage growth within the current plan, and price increases at renewal. Most SaaS companies see all four, though the mix shifts with how they package and price.
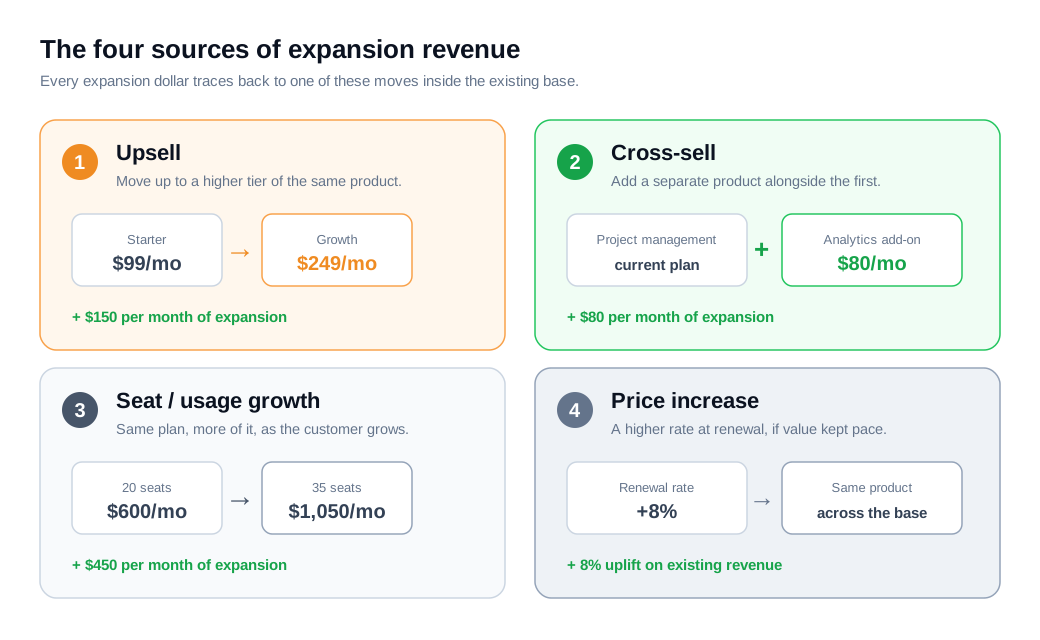
Upsell moves a customer to a higher tier of the same product. A team on a Starter plan at $99 a month upgrades to a Growth plan at $249 for advanced reporting, and the $150 difference is upsell revenue. Runway frames upselling as encouraging a customer toward a more capable version of what they already use.
Cross-sell adds a separate product or module alongside the first. A customer using your project management tool buys your analytics add-on for $80 a month. The customer keeps the original plan and widens the footprint, and the $80 is cross-sell revenue.
Seat or usage growth keeps the customer on the same plan but sells them more of it. A company that started with 20 seats at $30 each grows to 35 seats as it hires, adding $450 a month without changing tiers. On a usage-based product the same thing happens automatically as data volume, API calls, or transactions rise.
Price increases lift the rate an existing customer pays at renewal, often an inflation-linked uplift of 5 to 10 percent. Applied across a large base, a modest increase is real expansion revenue with no new product involved, though it works only when the value the customer gets has kept pace.
How do you calculate expansion revenue?
You calculate expansion revenue by adding up every dollar of recurring revenue that existing customers added in the period through upsells, cross-sells, seat and usage growth, and price increases, then dividing that sum by the recurring revenue you started the period with to get an expansion rate. Wall Street Prep lays out the same two steps: total the expansion MRR, then express it as a percentage of opening MRR.
Expansion rate = Expansion in the period / Starting recurring revenue.
Here is a worked example for a B2B SaaS company over one year. It starts the year with $5,000,000 in ARR from its existing customers. Over the next twelve months those same accounts add $260,000 from upsells, $140,000 from cross-sells, $150,000 from seat and usage growth, and $50,000 from renewal price increases.
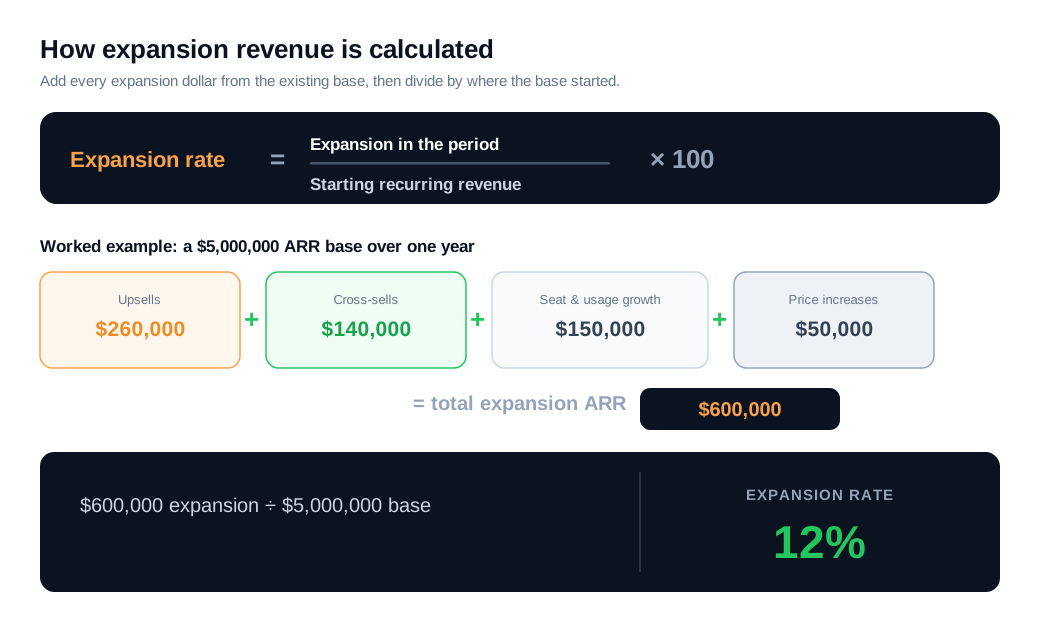
Add the four sources and total expansion ARR is $600,000. Divide that by the $5,000,000 the base started at, and the expansion rate is 12 percent. The existing customers grew their spend by 12 percent before the company counted a single new deal. Monthly teams run the same math on expansion MRR against opening MRR, then annualize.
What counts as a healthy rate depends on how big you are. ChartMogul found that expansion contributes about a third of all revenue gained once a company passes $1 million in ARR, and around 40 percent of growth for companies in the $15 million to $30 million range and above. Earlier-stage companies lean far more on new logos: Ordway reports that businesses under $1 million in ARR draw roughly 86 percent of growth from new customers and 14 percent from expansion, while companies in the $20 million to $50 million range run closer to a 62 to 38 split. Expansion is a lever that gets stronger as the base you can sell into gets bigger.
How does expansion revenue affect NRR?
Expansion revenue is the only input that can push net revenue retention above 100 percent, because NRR takes your starting base, adds expansion, then subtracts contraction and churn. Without expansion the best any company can do is hold flat, and most leak below 100 as customers downgrade and cancel.
Carry the worked example forward. The $5,000,000 base added $600,000 in expansion. Over the same year it gave back $120,000 to downgrades (contraction) and lost $280,000 to cancellations (churn).
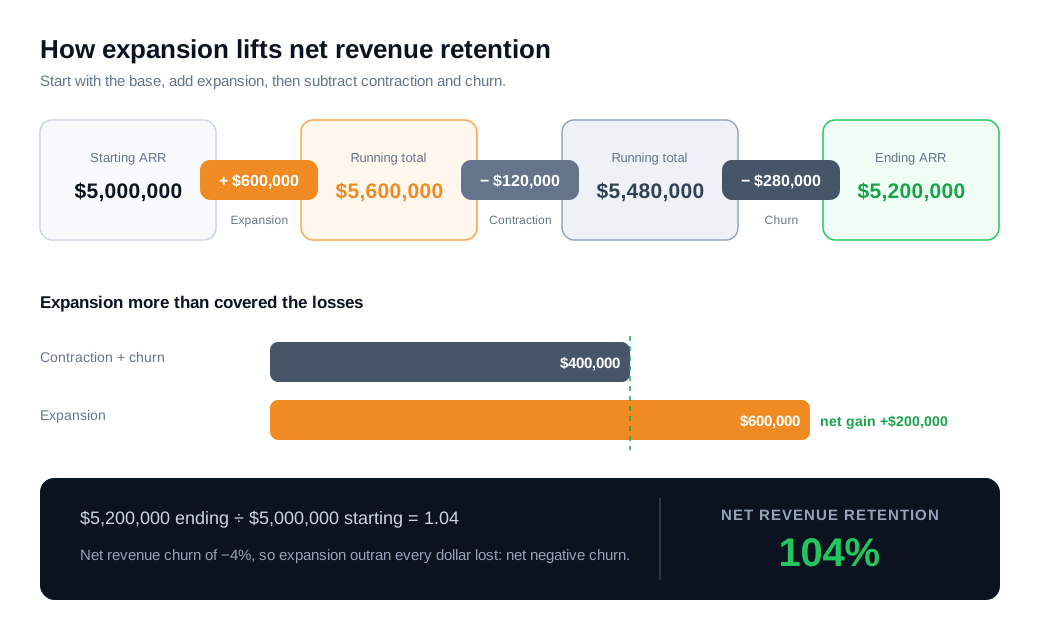
Run it through. Starting ARR of $5,000,000 plus $600,000 in expansion is $5,600,000. Take away $120,000 of contraction and $280,000 of churn, and the base ends at $5,200,000. Divide by the $5,000,000 you started with and NRR is 104 percent. Notice what carries the result: the company lost $400,000 to contraction and churn, and the $600,000 of expansion more than covered it. That is net negative churn, the state Paddle describes as expansion revenue exceeding the revenue lost to downgrades and cancellations, and here it runs at negative 4 percent net revenue churn.
Net negative churn is the outcome every recurring-revenue business wants, because it means the base grows on its own even if new sales stop. It is also uncommon. ChartMogul's benchmarks show that only about 47 percent of companies with average revenue per account above $1,000 a month reach it, and the share falls sharply for lower-priced, higher-volume products where churn is harder to outrun.
Why does expansion revenue cost less than new-customer growth?
Expansion revenue costs less because the hardest and most expensive parts of a SaaS sale are already done: you have found the account, earned its trust, and proved the product works. Selling more to that customer skips the outbound, the long evaluation, and much of the risk that makes new-logo acquisition slow and costly.
The cost gap is large. Alexander Group estimates that expanding an existing account costs between $0.20 and $0.69 to generate a dollar of annual contract value, while winning that same dollar from a new logo runs $1.50 to $3.00. Put a worked figure on it. A company that needs to add $1,000,000 in ARR might spend roughly $600,000 to buy it through new-logo sales at $0.60 on the dollar of blended cost, or closer to $400,000 if it expands existing accounts at $0.40. Same revenue, a third less spend, and usually a faster path to it.
That efficiency is why expansion carries so much weight in how investors read a business. Growth that comes cheaply from customers you already have is more durable and more predictable than growth you have to buy fresh every quarter, which is part of why high net revenue retention commands a premium on valuation. Expansion is the mechanism underneath that premium.
How do you drive expansion revenue?
You drive expansion revenue by building it into the product and pricing so revenue grows as customers succeed, then adding a human motion that catches expansion signals early and acts on them before renewal. One without the other stalls: pricing that never scales caps your upside, and a great pricing model with no one watching account health leaves easy expansion on the table.
A practical set of moves, roughly from foundation to upside:
- Price so growth is built in. Seat-based and usage-based models expand on their own as a customer hires or consumes more, with no upsell conversation required. Tiered packaging with clear feature gates gives customers an obvious reason to move up when they outgrow a plan.
- Get customers to value fast. Expansion is downstream of success. A customer who reaches the outcome they bought in the first weeks has a reason to add seats and modules, while one who never got started downgrades or leaves.
- Watch usage and act before renewal. Customers who bump into a usage limit, fill their seats, or ask about a higher-tier feature are telling you they are ready to expand. Reaching them in that moment, rather than at the annual renewal, is where much of the easiest expansion lives.
- Run renewals and reviews as expansion conversations. A quarterly business review that proves the value delivered in the last 90 days earns the right to map what the account needs next, which is where Planhat and other customer success teams tie upsell and cross-sell directly to customer goals.
- Make it easy to say yes in the moment. The gap between a customer asking "can it also do this" and buying the thing that does is where expansion is won or lost.
That last point is where day-to-day customer experience meets the metric. A customer who hits a limit and has to file a ticket and wait is a customer whose interest cools before anyone answers, while one who gets a real response in the moment often expands on the spot. Offering live chat inside the product, with the option to jump to a live video call or screen share when a question is faster to show than to type, closes those gaps as they appear. The same live conversations surface expansion signals early, since a customer asking how to do more is telling you they are ready to, and a lightweight proactive nudge when someone lingers on a pricing or upgrade page turns that interest into a conversation. Handled with the same speed you would give a hot inbound lead, expansion becomes a natural extension of the inbound sales motion rather than a separate campaign.
Key takeaways
- Expansion revenue is growth from customers you already have, the extra recurring revenue existing accounts add through upsells, cross-sells, seat or usage growth, and price increases, with new logos left out entirely.
- Four sources cover almost all of it, so the fastest way to raise expansion is to make each one easy: a tier to move up to, an add-on to buy, a plan that scales with usage, and a defensible renewal uplift.
- The math is simple, total the expansion in a period and divide by where the base started, and the rate you should expect climbs with scale, from roughly 14 percent of growth under $1 million ARR to around 40 percent above $15 million.
- Expansion is the only lever that lifts NRR above 100 percent, and when it outruns contraction and churn you reach net negative churn, where the base grows even with new sales paused, as in the worked example that lands at 104 percent NRR.
- It is the cheapest revenue you can book, costing between $0.20 and $0.69 per dollar of ACV against $1.50 to $3.00 for a new logo, which is why expansion-led growth earns a valuation premium.
- You drive it with pricing plus presence, building expansion into the model, getting customers to value quickly, watching usage, and answering the buying-signal questions in the moment they come up.
TAGS

Written by
Daniel SemeckyCo-founder & CEO
Daniel is the co-founder and CEO of Glimpze. He spends his days talking to revenue teams about how to catch high-intent visitors before they bounce, and writes about inbound sales, lead conversion, and building a motion where marketing and sales actually share a number.