On this page
A founder tells a board that new bookings hit $180,000 this quarter, and the room relaxes. Then the CFO asks how much of that recurs next year. The $180,000 turns out to be a single three-year deal, with a $30,000 implementation fee baked in, so the recurring piece is $150,000 spread across three years. On a yearly basis, the deal is worth $50,000.
Annual contract value is the metric that keeps that gap from surprising anyone. It reduces a contract of any length, with any mix of recurring and one-time charges, to a single comparable yearly figure, which is what lets you line up deals against each other, forecast revenue, and size a sales team without one long contract distorting the whole picture.
This post covers what ACV is, how to calculate it and what to leave out, how it differs from total contract value and from annual recurring revenue, how to use it in forecasting including the weighted version, and what a healthy ACV means for the shape of your sales motion.
What is annual contract value?
Annual contract value (ACV) is the average annualized revenue a single customer contract generates, normalized to one year and, in most definitions, stripped of one-time fees. It answers a narrow question: on a per-year basis, how much is this one contract worth?
Two words carry the weight. "Single" means ACV is a per-contract or per-account figure, so it describes the size of one deal rather than the revenue of the whole company. "Annualized" means a contract of any length gets folded down to a yearly rate, so a one-year deal and a five-year deal can sit in the same column and be compared honestly.
One caveat matters up front. ACV is not a standardized accounting metric, so there is no single formula every company is required to follow. Salesforce notes that businesses define it in slightly different ways, and the most common convention, which the rest of this post follows, is to exclude one-time fees and count only the recurring, repeatable value. Baremetrics frames ACV the same way, as the annualized recurring revenue from a customer contract. Whichever convention you adopt, the rule that keeps ACV useful is to apply it the same way to every deal.
How do you calculate ACV?
You calculate ACV by taking the total value of the contract, subtracting any one-time fees, and dividing the remainder by the number of years in the contract term. Written as a formula, that is ACV = (total contract value minus one-time fees) / number of years.
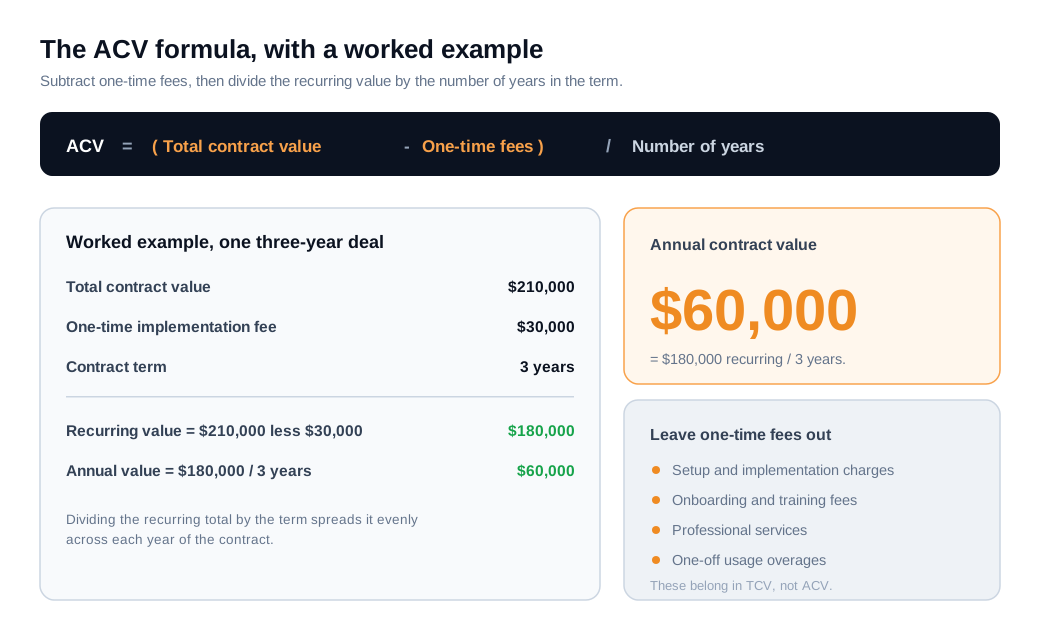
Here is a worked example. A customer signs a three-year contract with a total value of $210,000. Of that, $30,000 is a one-time implementation fee charged at kickoff, and the remaining $180,000 is recurring subscription revenue. Subtract the fee to get $180,000, then divide by three years. The ACV is $60,000.
The subtraction step is the one people skip, and it is where the number goes wrong. One-time fees do not recur, so folding them into ACV inflates a figure that is supposed to represent repeatable annual revenue. Paddle lists what to strip out: setup and implementation charges, onboarding and training fees, professional services, and one-off overages. Those belong in a different metric, covered in the next section.
A single-year contract is the simple case. With a one-year term there is nothing to divide, so the ACV is just the contract value minus any one-time fees. A $48,000 annual subscription with no setup fee has an ACV of $48,000. Companies that report an "average ACV" take this a step further and divide the total annual contract value across all customers by the number of customers, which gives the typical deal size for the book of business.
Ramped contracts add a wrinkle worth knowing. When a deal escalates over its term, say $40,000 in year one, $60,000 in year two, and $80,000 in year three, the calculation still divides the recurring total by the term, so the ACV is $180,000 divided by three, or $60,000. That blended average is fine for comparison and headline reporting. For forecasting the revenue you will actually recognize each year, keep the year-by-year schedule underneath it, since year one and year three are far apart.
How does ACV differ from TCV?
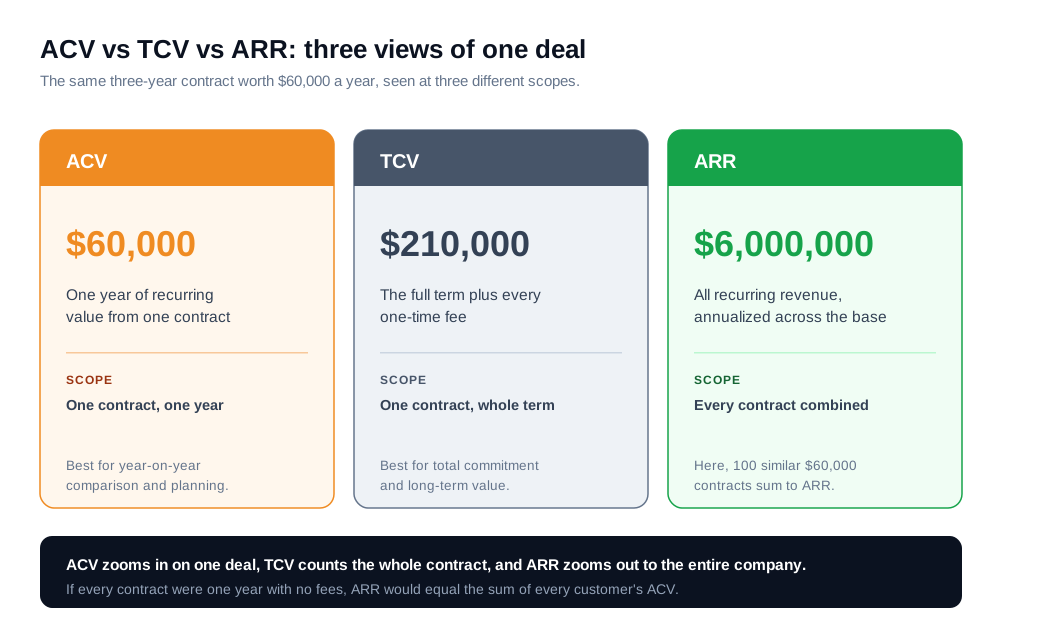
ACV measures one year of a contract's recurring value, while total contract value (TCV) measures the entire worth of the contract across its full term, including the one-time fees ACV leaves out. ACV is the yearly slice, and TCV is the whole pie.
The formula makes the contrast concrete. Wall Street Prep defines TCV as the recurring revenue over the full term plus any one-time fees, which is the same as monthly recurring revenue times the contract length in months, plus those fees.
Run the earlier deal through both. The three-year contract has $180,000 of recurring revenue and a $30,000 implementation fee. TCV is $180,000 plus $30,000, or $210,000, the full amount the customer is committed to pay across three years. ACV is $60,000, the recurring value of a single year. Same contract, two very different numbers, each answering a different question.
The two metrics fit different jobs. Orb points out that ACV is the better lens for year-on-year comparisons and near-term planning, because it normalizes deals of different lengths, while TCV is better for judging the long-term commitment a customer has made. A rep chasing a big TCV number can be tempted toward long contracts with heavy upfront fees, so many teams compensate their sales force on ACV to keep the incentive pointed at sustainable recurring revenue.
How does ACV differ from ARR?
ACV describes the annual value of a single contract, while annual recurring revenue (ARR) sums the recurring revenue across your entire customer base. The difference is scope: ACV zooms in on one deal, and ARR zooms out to the whole company.
Because they operate at different levels, the two connect naturally. If every contract were exactly one year and free of one-time fees, your ARR would be the sum of every customer's ACV. Chargebee describes ACV as an account-level view and ARR as the company-wide total, which is why the two are often quoted together: ACV tells you how big a typical deal is, and ARR tells you how much recurring revenue all those deals add up to.
A quick example shows the relationship. A company with 100 customers, each on a contract with an ACV of $60,000, is running roughly $6 million in ARR. Watch the two over time and they tell a layered story. Rising ARR with flat ACV means you are winning more customers of the same size. Rising ACV means the deals themselves are getting bigger, through upsells, longer terms, or a move upmarket.
How do you use ACV in forecasting?
You use ACV in forecasting by translating every open opportunity into a comparable annual number, then weighting each deal by its probability of closing to project the revenue your pipeline will actually produce. Raw deal size overstates the picture, because a five-year contract looks five times larger than a one-year contract of the same yearly value, and ACV removes that distortion before you forecast.
Salesforce describes the pipeline use directly: estimate the total ACV of the deals in your pipeline and forecast revenue based on how likely each is to close. The refined version is weighted ACV, where each deal's ACV is multiplied by the win probability tied to its pipeline stage, so a $60,000 opportunity at 40% contributes $24,000 to the forecast.
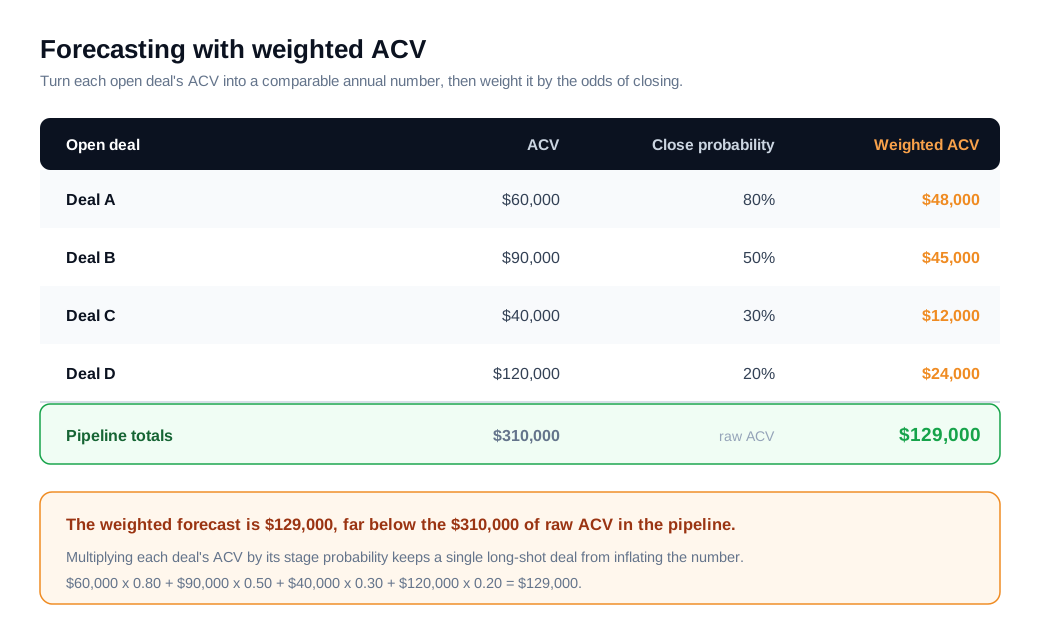
Here is a worked pipeline. You have four open deals: $60,000 ACV at 80% probability, $90,000 at 50%, $40,000 at 30%, and $120,000 at 20%. Multiply each by its probability and you get $48,000, $45,000, $12,000, and $24,000. Add them up and the weighted forecast is $129,000, even though the raw ACV in the pipeline totals $310,000. The weighting is what keeps a single long-shot deal from making the number look better than it is.
ACV also drives capacity planning. If your average ACV is $60,000 and next year's new-business target is $3 million, you need 50 new deals to hit it. Divide that by your win rate and average sales cycle and you know how many opportunities each rep has to source and work, which turns a revenue goal into a staffing plan. Kixie describes this same use, converting expected win rates and deal sizes into realistic revenue projections.
What counts as a good ACV, and how does it shape your sales motion?
There is no universal "good" ACV, and the figure that matters is whether your ACV can pay for the sales motion required to win and keep the customer. A $500 ACV cannot support a field sales team and a nine-month sales cycle, and a $200,000 ACV rarely closes through a self-serve checkout.
ACV tends to sort companies into rough segments, and the sales cycle stretches as the number climbs. Drawing on CRM data from 939 B2B SaaS companies, Optifai reports a median sales cycle of 84 days, with small-business deals under $15,000 of ACV closing in roughly 14 to 30 days, mid-market deals from $15,000 to $100,000 taking 30 to 90 days, and enterprise deals above $100,000 running 90 to 180 days or more. Larger contracts bring bigger buying committees and more security review, which is why the cycle lengthens rather than the price alone.
That relationship is why ACV is really a decision about go-to-market design. A low-ACV, high-volume motion lives or dies on efficiency and speed, since you cannot afford a long human sales process for a small deal. Answering buyers the moment they show interest, with live chat on your pricing and product pages, keeps acquisition cost low enough for the model to work, and it feeds the fast, self-directed inbound sales motion that low-ACV products depend on. A higher-ACV motion can justify more hands-on selling, where a live demo or screen share with an evaluation committee earns its place because a single closed deal is worth tens of thousands a year.
The practical move is to track ACV over time and watch its direction. A rising average ACV usually means you are moving upmarket, which should be paired with a deliberately longer, higher-touch sales process. A falling ACV asks the opposite question: is the motion cheap and fast enough to stay profitable at that deal size?
Key takeaways
- ACV is a per-contract yearly figure. It reduces a single customer's contract, of any length, to the recurring revenue it produces in one year, so deals of different terms can be compared on equal footing.
- The formula subtracts one-time fees, then divides by the term. ACV equals total contract value minus one-time fees, divided by the number of years, and skipping the fee subtraction inflates a number meant to capture repeatable revenue.
- TCV is the whole contract, ACV is one year of it. TCV counts the full multi-year commitment plus one-time fees, which suits total-value questions, while ACV is the better lens for year-on-year comparison and near-term planning.
- ACV is per-account, ARR is company-wide. ACV sizes a typical deal, ARR sums recurring revenue across every customer, and watching both reveals whether growth comes from more customers or bigger ones.
- Weight ACV by win probability to forecast. Multiplying each open deal's ACV by its stage-based close probability projects pipeline revenue without letting one long-shot deal overstate the number.
- A good ACV is one your sales motion can afford. Higher ACV justifies longer, higher-touch selling, lower ACV demands speed and efficiency, and the sales cycle reliably lengthens as ACV rises.
TAGS

Written by
Daniel SemeckyCo-founder & CEO
Daniel is the co-founder and CEO of Glimpze. He spends his days talking to revenue teams about how to catch high-intent visitors before they bounce, and writes about inbound sales, lead conversion, and building a motion where marketing and sales actually share a number.