
On this page
A support leader, a product manager, and a finance lead can look at the same customer and reach three different verdicts. The support leader sees an 85 percent satisfaction rating and calls the account healthy. The product manager sees a low effort score on last week's signup flow and calls it a problem. The finance lead sees the same customer marked a detractor on the loyalty survey and calls it a churn risk. All three are reading a real number, and all three numbers are true.
CSAT, NPS, and CES are the three metrics most teams reach for, and they get treated as interchangeable far too often. That is a mistake with a cost. Each metric was built to answer a specific question at a specific point in the customer relationship, and picking the wrong one leaves you staring at a figure that looks fine while the thing you actually care about quietly slips.
This guide covers what each metric measures, how to calculate all three, what a good score looks like, when to reach for which, and how to run them together without burying your customers in surveys.
What does each metric actually measure?
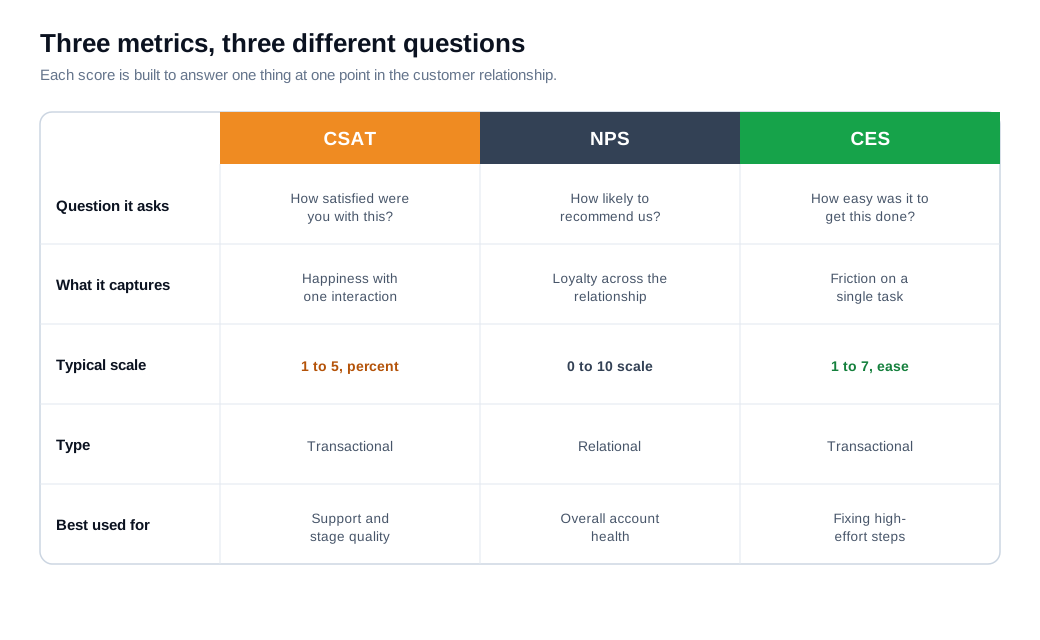
Each metric measures a different thing: CSAT measures how satisfied a customer is with one interaction, CES measures how hard they had to work to get something done, and NPS measures how willing they are to recommend you across the whole relationship. Line them up and the split is obvious.
CSAT, the customer satisfaction score, is a snapshot of happiness right after a touchpoint. It asks a question like "How satisfied were you with this interaction?" and it is transactional, meaning it captures a single moment. You fire it after a support ticket closes, after onboarding finishes, or right after a purchase, and it tells you whether that specific event met expectations.
CES, the customer effort score, is also transactional, but it measures friction instead of feelings. It asks how much effort the customer had to expend, usually with a prompt like "How easy was it to resolve your issue?" on an ease scale. A high CSAT and a low CES can sit side by side on the same interaction: the customer got what they wanted and is satisfied, but it took four replies and a phone call to get there.
NPS, the net promoter score, is the odd one out because it is relational rather than transactional. It asks one forward-looking question, "How likely are you to recommend us to a friend or colleague?" on a scale of 0 to 10, and the answer reflects the entire relationship rather than any single event. It is a loyalty and word-of-mouth signal, not a service score.
The lineage matters here. NPS was introduced by Fred Reichheld in a 2003 Harvard Business Review article, built on two years of research linking survey answers to actual purchasing and referral behavior. CES came later, from CEB (now part of Gartner) in the 2010 HBR article "Stop Trying to Delight Your Customers," which studied more than 75,000 customer interactions and found that reducing effort drives loyalty more reliably than trying to exceed expectations.
How do you calculate CSAT, NPS, and CES?
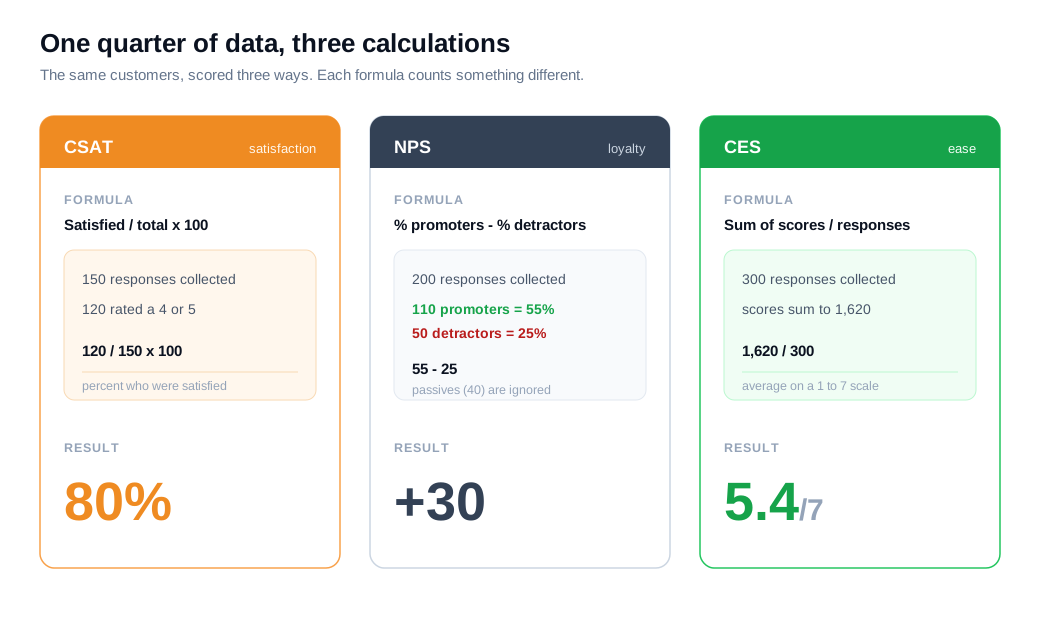
None of the three formulas is complicated: CSAT is the percentage of responses that count as satisfied, NPS is the percentage of promoters minus the percentage of detractors, and CES is the average score on an ease scale. The differences are in what you count, not in the arithmetic.
CSAT runs on a rating scale, most often 1 to 5, where 5 is very satisfied. You count the "satisfied" responses, which usually means the 4s and 5s, divide by the total number of responses, and multiply by 100. The formula is (satisfied responses divided by total responses) times 100. Some teams only count the top box, the 5s, for a stricter read.
NPS runs on the 0 to 10 recommendation scale and sorts respondents into three buckets. As Qualtrics lays it out, scores of 9 or 10 are promoters, 7 or 8 are passives, and 0 through 6 are detractors. You take the percentage of promoters, subtract the percentage of detractors, and ignore the passives entirely. The result lands somewhere between -100 and +100.
CES runs on an ease scale, commonly 1 to 7, where 7 is very easy. The standard method, described by HubSpot, is to add up every response and divide by the number of responses for a single average. A common alternative reports the percentage of respondents who scored in the easy range, usually 5 to 7.
Here is a worked example using one quarter of real-looking data.
Your support team sends a 1 to 5 CSAT survey after every resolved ticket. Out of 150 responses, 120 people rated the interaction a 4 or 5. CSAT is 120 divided by 150, times 100, which is 80 percent.
Your relationship team sends an NPS survey to active accounts and gets 200 responses: 110 promoters, 40 passives, and 50 detractors. Promoters are 55 percent, detractors are 25 percent, so NPS is 55 minus 25, which is 30.
Your product team fires a 1 to 7 CES survey after signup and collects 300 responses that sum to 1,620 points. The average is 1,620 divided by 300, which is 5.4 out of 7. Read together, those three numbers describe the same customers from three angles.
What counts as a good CSAT, NPS, or CES score?
A good score depends heavily on your industry, but rough anchors hold: CSAT in the 75 to 85 percent range is healthy, an NPS above 50 is excellent, and a CES above 5 on a 7-point scale is solid. Treat these as starting lines, then benchmark against your own sector.
For CSAT, Retently puts the cross-industry average near 78 percent, with 75 to 85 percent considered healthy and anything above 90 percent exceptional. Context swings the target hard. Financial services and SaaS tend to sit around 80 to 83 percent, while cable and telecom often live in the low 60s, so a 75 percent score can be strong in one industry and mediocre in another.
For NPS, the scale itself makes any positive number a net win, since it means you have more promoters than detractors. SurveyMonkey frames a score of 30 to 50 as good and 50 or higher as excellent, the level Bain and Company treats as a benchmark for outstanding loyalty. B2C companies generally post higher medians than B2B, and software sits toward the lower end, so the NPS of 30 in the earlier example is respectable for a SaaS product and weak for a consumer brand.
For CES, the interpretation is straightforward because the scale points at ease. On a 1 to 7 scale, an average above 5 is good and above 6 is excellent, while anything under 4 signals a process that is fighting your customers. The evidence for chasing a low-effort experience is strong: CEB's research, published in The Effortless Experience, found that 94 percent of customers with low-effort interactions intended to repurchase, while 81 percent of those who had to work hard said they would spread negative word of mouth.
When should you use CSAT vs NPS vs CES?
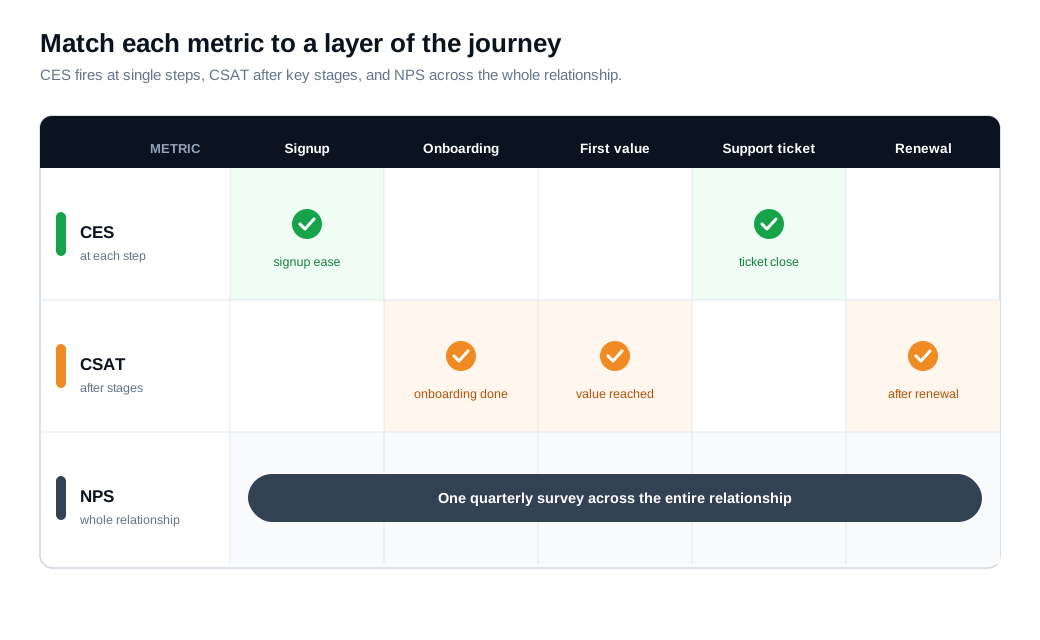
Match the metric to the layer of the journey you are measuring: use CES at individual steps, CSAT after key stages or interactions, and NPS at the relationship level on a regular cadence. Get that mapping right and each survey points at a decision you can act on.
CES belongs at the friction points, the specific steps where a customer is trying to get something done. Smaply recommends deploying it at moments like signup, checkout, password reset, and the close of a support ticket. The question is narrow, so the answer is too, and a 3-out-of-7 on your onboarding flow tells you exactly which step to fix. When a rep resolves a stuck visitor in one session over live chat instead of a three-day email thread, that difference is the effort CES is built to catch.
CSAT belongs after meaningful interactions and stage completions. Send it once onboarding wraps, after a customer reaches first value, or right after a support case closes. It captures whether that stage delivered what it promised, and because it is quick to answer, response rates stay high when you send it within minutes of the event rather than a week later.
NPS belongs at the relationship layer, on a cadence rather than an event trigger. Most teams run it quarterly or twice a year. The question is broad on purpose, so firing it after every ticket would only produce noise. Use it to read overall account health, benchmark against competitors, and flag detractors before a renewal comes up.
How do you combine CSAT, NPS, and CES?
Combine them by assigning each metric to a different layer of the journey so they diagnose separate problems instead of echoing the same one. CES and CSAT act as leading indicators at the step and stage level, and NPS acts as a lagging, strategic read on whether all that adds up to loyalty.
The practical pattern is a chain of cause and effect. NPS tells you loyalty moved, but not why. When it drops, you pull the CSAT and CES scores from the stages and steps in that account's recent history to locate the damage. If a detractor's last three support tickets carried a CES of 2 and a CSAT of 40 percent, you have found your suspect, and you have a specific flow to repair rather than a vague sense that something is wrong.
Run the low-level metrics continuously and the relational one periodically. Track CES and CSAT after interactions to catch friction and dissatisfaction in near real time, then run NPS on a schedule to check whether those fixes are translating into customers who would recommend you. Cutting effort is often where the biggest gains sit, and deflecting repetitive questions to an AI chat assistant that draws on your help content lowers CES on the routine cases while freeing your team for the ones that need a person.
One rule keeps a combined program honest, drawn from how Balto frames it: tie every survey to a decision. If no one is going to act on the answer, do not ask the question. A metric nobody uses is just survey fatigue with a dashboard.
Should you use all three, or pick one?
Most teams should choose one primary metric and treat the other two as supporting diagnostics, because running all three with rigor costs more attention than the average program has. Spreading effort thin across three scoreboards usually produces three mediocre ones.
Let the metric follow the job. A support organization judged on service quality leans on CSAT and CES, because those measure the interactions the team controls. A product or growth team worried about churn and word of mouth anchors on NPS, then uses CES to hunt down the effort that erodes it. A self-serve product where activation is the whole game may make CES the headline number, since a hard signup quietly kills conversion before loyalty ever enters the picture.
Whichever you pick, the deeper value shows up in the follow-up question, not the number. A rating tells you where you stand, and the "why did you give that score?" comment field tells you what to do about it. The score starts the conversation; the free text is where the work actually gets planned.
Key takeaways
- Each metric answers a different question. CSAT rates satisfaction with one interaction, CES rates how hard a task was, and NPS rates loyalty across the whole relationship, so they are not substitutes for one another.
- The formulas are simple, the inputs differ. CSAT is satisfied responses over total, NPS is percent promoters minus percent detractors, and CES is the average on an ease scale, each read on its own scale.
- Benchmark inside your industry. CSAT of 75 to 85 percent is healthy, an NPS above 50 is excellent, and a CES above 5 out of 7 is solid, but a good number in banking can be a weak one in SaaS.
- Map the metric to the journey layer. Put CES at individual steps, CSAT after key stages and interactions, and NPS at the relationship level on a quarterly cadence.
- Combine them as a diagnostic chain. Let NPS flag that loyalty moved, then use CSAT and CES from recent touchpoints to locate the exact stage or step that caused it.
- Pick one primary metric and act on the comments. Running all three well is expensive, so anchor on the one that fits your job and treat the follow-up "why" as the part that drives decisions.

Written by
Nilas MylerCo-founder & CTO, Glimpze
Nilas is the co-founder and CTO of Glimpze, an inbound sales tool that turns high-intent website visitors into live conversations. A former SEO consultant for some of the largest companies in Denmark, he writes about speed-to-lead, inbound sales, and conversion rate optimization — the technical and operational mechanics of turning traffic into pipeline.


