
On this page
A customer needs to reset a password. The first link expires before they click it, so they request another. That email lands in spam, so they open a chat, get told to email support, wait a day, then call and repeat the whole story to a new agent. The password gets reset. The customer is also quietly done with you.
Customer effort score is the metric that catches that story while there is still time to change the ending. It asks one question right after an interaction, how hard was that, and turns the answer into a number a team can track, compare, and act on. The research behind it is blunt: the easy path keeps customers, and the hard path loses them.
This post covers what customer effort score is, how to measure and calculate it, what counts as a good score, why effort predicts loyalty better than delight, how CES compares with NPS and CSAT, when to send the survey, and the tactics that actually reduce effort.
What is customer effort score?
Customer effort score (CES) is a single-question survey metric that measures how much work a customer had to do to get something done with your company, whether that meant resolving an issue, buying a product, or finding an answer. It compresses a whole interaction into one number, usually an average on a fixed scale, so a team can see at a glance whether the experience was smooth or a slog.
The metric came out of research at the Corporate Executive Board, now part of Gartner, published in a 2010 Harvard Business Review article called "Stop Trying to Delight Your Customers." The authors studied more than 75,000 people interacting with contact centers and self-service channels and found that the effort a person spends to get a problem solved tracks loyalty more closely than almost anything else a service team measures.
CES is a transactional metric, tied to a specific moment. It does not ask how a customer feels about your brand in general. It asks about the interaction that just happened, which is why the answer points so precisely at the step that needs work.
How do you measure CES?
You measure CES by sending a one-question survey right after an interaction and averaging the numeric responses. The modern version, often called CES 2.0, presents a statement, "The company made it easy for me to handle my issue," and asks the customer to rate their agreement on a 1 to 7 scale from strongly disagree to strongly agree, where 7 is the easiest, as Qualtrics lays out in its guide to the metric.
Two calculations are common. The first is a straight average: add every rating and divide by the number of responses. The second is the top-box, or "percentage of easy," method: count the share of people who answered 5, 6, or 7, since those are the customers who found the experience easy.
Here is a worked example. Say a support team sends the CES survey after every resolved ticket and gets 250 responses in a month. Seventy people answer 7, sixty answer 6, forty-five answer 5, thirty answer 4, twenty answer 3, fifteen answer 2, and ten answer 1. Multiply each rating by its count, sum the pieces, and you get 1,295 effort points across 250 responses, an average of 5.18. Count the 5s, 6s, and 7s and you get 175 easy responses, or 70 percent top-box.
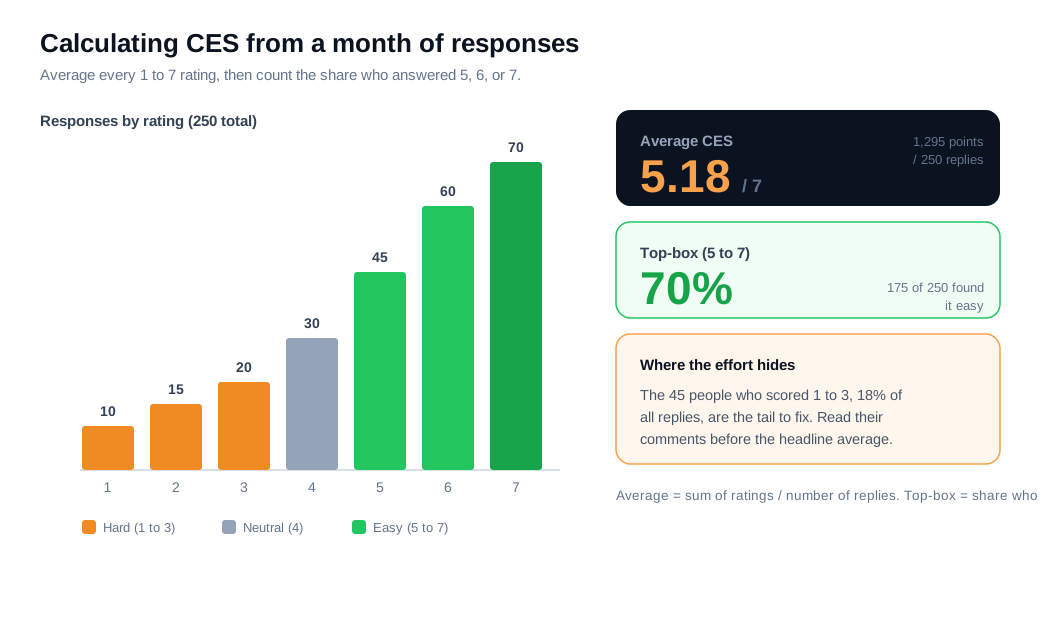
Those two numbers tell slightly different stories. The 5.18 average sits mid-pack, while the 70 percent top-box says most people did have an easy time. The 45 responses in the 1 to 3 range, 18 percent of the total, are where the effort problem lives, and reading their open-text comments is usually more useful than staring at the headline score.
What is a good customer effort score?
A good customer effort score on the 1 to 7 scale is roughly 5.5 or higher, with a top-box easy rate around 70 percent or more counting as strong. On a 1 to 5 scale, 3.5 and up is decent and 4.0 and up is excellent. Cross-industry averages tend to land between 5.0 and 5.8 on the seven-point scale, according to Formbricks' benchmark roundup.
Benchmarks shift by context. B2B software support often runs a little higher than high-volume consumer support, where interactions are more varied and messy. The example team above, at a 5.18 average and 70 percent top-box, is doing fine on the easy rate and has clear room to move the average up by chipping away at that 18 percent tail.
The number that matters most is your own trend. A CES that climbs quarter over quarter, on the same question and the same scale, means friction is coming out of the journey. Chasing a competitor's published figure is less useful, since scales, wording, and survey timing vary enough to make cross-company comparisons shaky.
Why does effort predict loyalty?
Effort predicts loyalty because the research shows hard experiences drive customers away far more reliably than easy experiences pull them in. In the CEB study behind CES, 96 percent of customers who had a high-effort service experience grew more disloyal, compared with only 9 percent of those who had a low-effort experience, a gap Gartner still highlights in its work on the effortless experience.
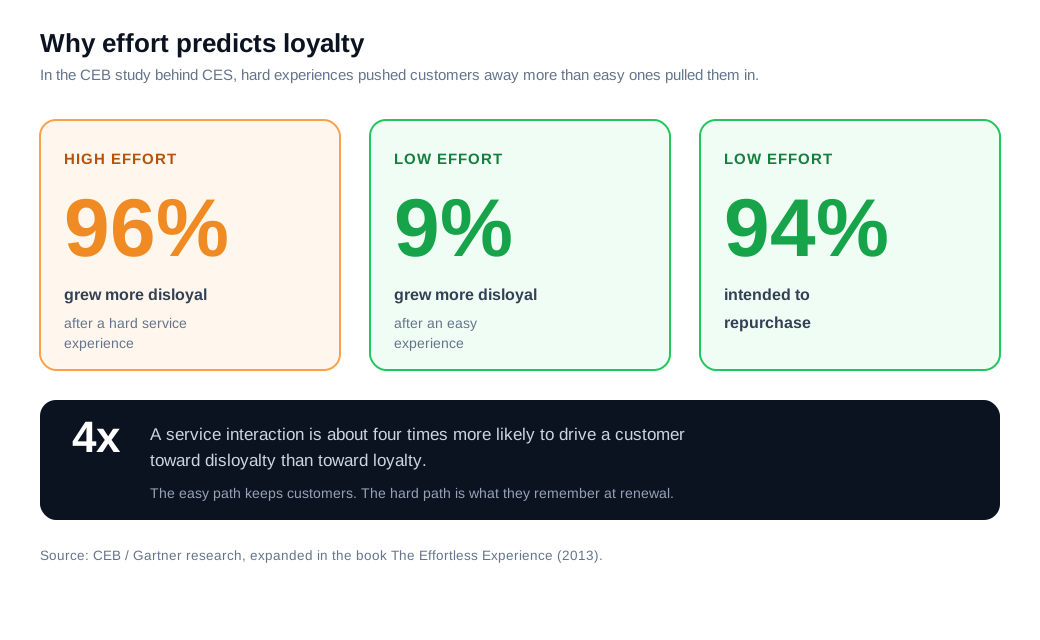
The repurchase numbers point the same way. Ninety-four percent of customers with a low-effort interaction said they intended to buy again, against a small fraction of those who had to fight for a resolution. The same body of work found that a service interaction is about four times more likely to make a customer disloyal than loyal, which reframes what a support team is really there to do.
The reason is human. When a task is easy, customers barely register it; they got what they came for and moved on. When a task is hard, the friction stacks up and becomes the memory: the repeated explanation, the transfer, the day of waiting. That memory is what surfaces at renewal time. The book that expanded the research, "The Effortless Experience" (2013), argues that stripping out that friction is a more dependable route to loyalty than trying to wow people with extras most of them never asked for.
How is CES different from NPS and CSAT?
CES differs from NPS and CSAT in what it measures and when it fires: CES gauges the effort of a single interaction, CSAT gauges satisfaction with a specific experience, and NPS gauges overall loyalty to the brand. CES and CSAT are transactional, sent right after a step, while NPS is relational, tracked at broader intervals to read the health of the whole relationship, as QuestionPro breaks down.
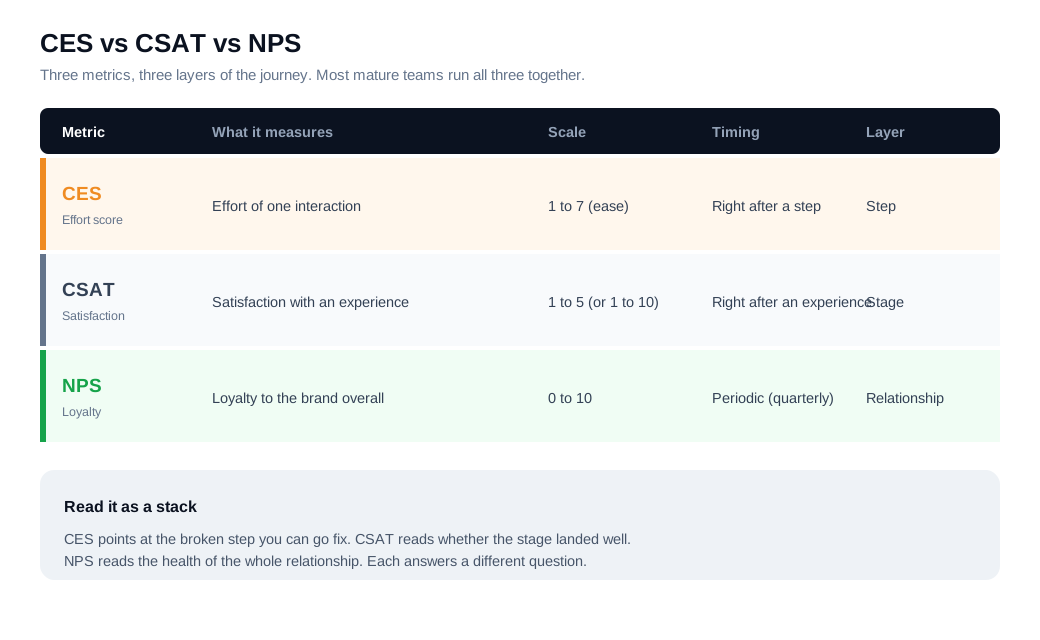
They answer different questions. NPS at the relationship level tells you whether a customer is likely to stay and recommend you. CSAT at the stage level tells you whether a given experience landed well. CES at the step level tells you which specific interaction is costing people effort and needs to be redesigned.
Mature programs run all three at different layers rather than picking a favorite. A team might track CES and CSAT after every support ticket or onboarding step, then survey NPS quarterly to see whether the operational fixes are moving the relationship. CES is the sharpest of the three for diagnosis, because a low score points straight at a broken step you can go fix.
When should you send a CES survey?
You should send a CES survey immediately after the interaction you want to measure, ideally within minutes and never more than a day later. CES asks about the effort of a specific action, so the memory has to be fresh. A survey that arrives a week later measures a fading impression rather than the interaction itself.
The best trigger points are the moments where effort is created. Right after a support ticket is resolved. Right after a customer completes checkout or finishes signup. Right after an onboarding milestone, a self-service search, or a returns request. Each of those is a discrete step you can score and, if it runs high on effort, rebuild.
Keep the survey to the one rating, or the rating plus a short open-text "what made it hard?" follow-up. The whole strength of CES is that it is quick enough to answer in the same tab, seconds after the event, while the friction is still fresh in the customer's mind. Bury it in a ten-question form a week later and the signal is gone.
How do you reduce customer effort?
You reduce customer effort by finding the specific sources of friction the score exposes and then redesigning interactions so the customer does less work to reach an outcome. The Effortless Experience research names the usual culprits: switching channels, having to make repeat contacts, generic service that ignores context, and difficult escalations.
Channel switching is a heavy one. When a customer starts in chat, gets told to send an email, then has to call and re-explain from scratch, effort compounds at every hop. Meeting people in the channel where they already are cuts that cost, which is why live chat on the page where a question comes up tends to score better than a support queue that bounces the customer around.
Repeat contacts are another. A team can lower effort by solving the next likely issue before the customer has to come back for it, an approach the research calls forward resolution: answer the question that was asked, then head off the obvious follow-up. Warm handoffs help too, so a customer who does need a person arrives with their context intact instead of starting over, which is largely a matter of solid routing and notifications.
Self-service is where a surprising amount of effort hides. Gartner found that only 14 percent of customer service issues are fully resolved in self-service, which means most people who try to help themselves end up contacting a human anyway, now more frustrated than when they started, per Gartner's 2024 survey. A well-tuned AI chat assistant that actually resolves common questions, and hands off cleanly to a person when it cannot, removes a whole tier of low-value effort. The real test is whether the customer got the answer without a second try, which counts for more than any deflection rate a tool claims.
Return to the team from earlier. They read the comments behind their 45 low-effort scores and find that most of them mention re-explaining an issue after a transfer. They add context to every handoff and start answering the common downstream question up front. The next month, the 1 to 3 tail shrinks from 18 to 11 percent, the top-box rate rises from 70 to 78 percent, and the average moves from 5.18 to 5.6. Same survey, same scale, less work landed on the customer.
Key takeaways
- Customer effort score is a one-question metric that measures how hard a customer had to work to get something done, scored right after the interaction and averaged into a single number.
- Measure it with the CES 2.0 statement, "the company made it easy to handle my issue," on a 1 to 7 scale, then track both the average and the top-box percentage who answered 5 to 7.
- A good CES sits around 5.5 or higher on the seven-point scale, or roughly 70 percent top-box, though your own quarter-over-quarter trend matters more than any published benchmark.
- Effort predicts loyalty because hard experiences repel more strongly than easy ones attract; in the founding study, 96 percent of high-effort customers grew more disloyal versus 9 percent of low-effort ones.
- Use CES, CSAT, and NPS as a stack, firing CES and CSAT after each step and tracking NPS at the relationship level, since each one reads a different layer of the journey.
- Cut effort at the source by ending channel switching, resolving the next likely issue in advance, passing warm handoffs with full context, and using self-service only where it truly resolves the question.

Written by
Nilas MylerCo-founder & CTO, Glimpze
Nilas is the co-founder and CTO of Glimpze, an inbound sales tool that turns high-intent website visitors into live conversations. A former SEO consultant for some of the largest companies in Denmark, he writes about speed-to-lead, inbound sales, and conversion rate optimization — the technical and operational mechanics of turning traffic into pipeline.


