
On this page
Most marketing dashboards show one blended conversion rate. That single number treats a warm customer referral and a cold paid-social click as the same lead, which they almost never are once sales gets involved.
Break conversion down by lead source and the story changes. One channel can produce half of your leads and almost none of your revenue, while another quietly delivers the customers who renew. This guide covers how to measure conversion rate by lead source, how to attribute leads without fooling yourself, what the benchmarks actually look like, and how to move budget toward the sources that close.
Here is the path: the formula and what it measures, why source-level tracking matters, how attribution works in practice, which sources tend to convert best, how to rebalance spend, and the mistakes that quietly distort the whole exercise.
What does conversion rate by lead source mean?
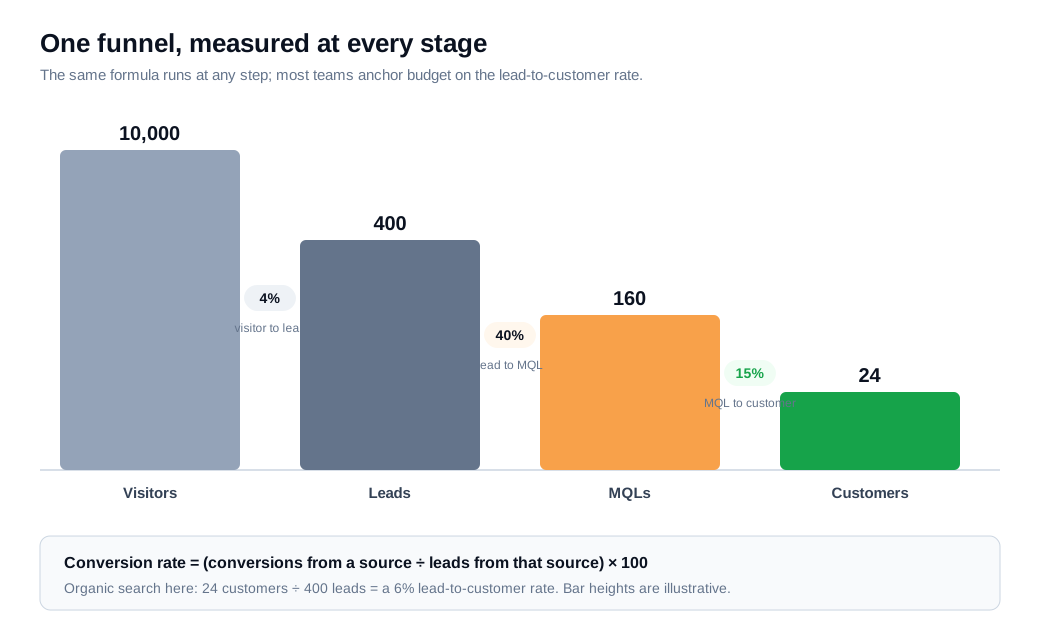
Conversion rate by lead source is the percentage of leads from a specific channel that complete a defined action, calculated as conversions from that source divided by total leads from that source, times 100. The "conversion" can be any step you care about: a visitor becoming a lead, a lead becoming a marketing qualified lead (MQL), or a lead becoming a paying customer.
The formula holds at every stage. If organic search sent 400 leads last quarter and 24 became customers, its lead-to-customer conversion rate is 24 divided by 400, or 6 percent. If paid social sent 900 leads and 27 closed, that is 3 percent. Same funnel step, very different efficiency.
Pick the funnel step on purpose. Visitor-to-lead tells you how well a channel's traffic matches your offer. Lead-to-MQL reflects lead quality. Lead-to-customer, and the revenue per lead behind it, is the number that pays the bills, so most teams anchor budget decisions there and use the earlier steps to diagnose why a source runs hot or cold.
One extra refinement is worth the effort: weight the result by revenue as well as deal count. A source that closes fewer but larger deals can out-earn a higher-converting source of small accounts, so a channel that looks weak on conversion rate alone may be your best earner. Track conversion rate and average deal value side by side, and the ranking of your sources will sometimes flip. That is why revenue per lead, calculated as total revenue from a source divided by its lead count, is the figure many analysts trust more than the raw conversion percentage.
Why track conversion by source?
Track conversion by source because a single blended rate hides which channels create revenue and which only create work. Two sources can post identical lead counts and wildly different outcomes once you follow them to closed-won.
Consider a team generating 1,000 leads a month at a blended 4 percent close rate. That reads as healthy. Split it apart and you might find referrals converting at 12 percent while a paid channel that supplies 40 percent of the volume converts at 1.5 percent. The average does you a disservice. It makes a weak channel look acceptable and a strong one look ordinary, and it invites you to keep funding the wrong thing.
Source-level data changes four decisions. It tells you where to spend, which leads to route to your best reps first, what to say in follow-up (a referral and a cold ad click need different openings), and where the funnel leaks. It also reframes cost. A source with a high cost per lead can still be your cheapest source of customers if it converts well, and a cheap-per-lead channel can become your most expensive once you divide spend by actual customers rather than by form fills.
How do you attribute conversions to sources?
You attribute conversions by tagging each lead with its origin at capture, storing that origin in your CRM, and then choosing an attribution model that decides which touch gets credit. The plumbing and the model are separate problems, and both have to be right for the numbers to mean anything.
For the plumbing, the standard is UTM parameters on every campaign link (utm_source, utm_medium, utm_campaign) captured into hidden form fields and written to dedicated CRM fields so the value survives from click to lead record. Teams that skip this lose the data in the gap between analytics and the CRM, which is why so much traffic ends up dumped into "direct" or "unknown." A self-reported "How did you hear about us?" field is a useful cross-check, because it catches offline and word-of-mouth sources that no tracking pixel will ever see.
For the model, the two simplest options answer different questions. First-touch attribution gives all the credit to the channel that first found the lead, so it measures which sources start relationships and fill the top of the funnel. Last-touch gives all the credit to the final interaction before conversion, so it measures which sources close. Neither is complete on its own, because real buyers can pass through many touches before they buy. Multi-touch models spread credit across the journey, either evenly or weighted toward the first and last touch as in a W-shaped model, and they give the fairest read once you have the tooling to support them.
A quick example shows why the choice matters. Suppose a buyer finds you through an SEO article, returns a week later from a retargeting ad, and finally converts after clicking a nurture email. First-touch credits SEO, last-touch credits email, and a W-shaped model splits the credit across all three. Report only one of them and two real contributors disappear from your source data, which is how good channels get defunded by accident.
Pick one primary model and stay with it. Switching models between quarters makes every channel look like it improved or collapsed for reasons that have nothing to do with performance.
Which sources typically convert best?
Referrals and other warm, high-intent sources almost always convert best, while broad paid and social channels sit near the bottom. The ranking is consistent across benchmark studies, even though the exact percentages move a lot by industry.
First Page Sage's lead-to-MQL benchmarks put client referrals at the top at 56 percent, the highest of any source, against a 31 percent cross-industry average. By channel, email leads at 43 percent, SEO at 41 percent, and pay-per-click at 36 percent, with B2B SaaS companies averaging 39 percent overall. Ruler Analytics, drawing on more than 5 million tracked conversions across 13 industries, shows the same logic at the visitor-to-lead stage: organic and referral traffic tend to convert ahead of paid channels, though every figure swings widely by vertical.
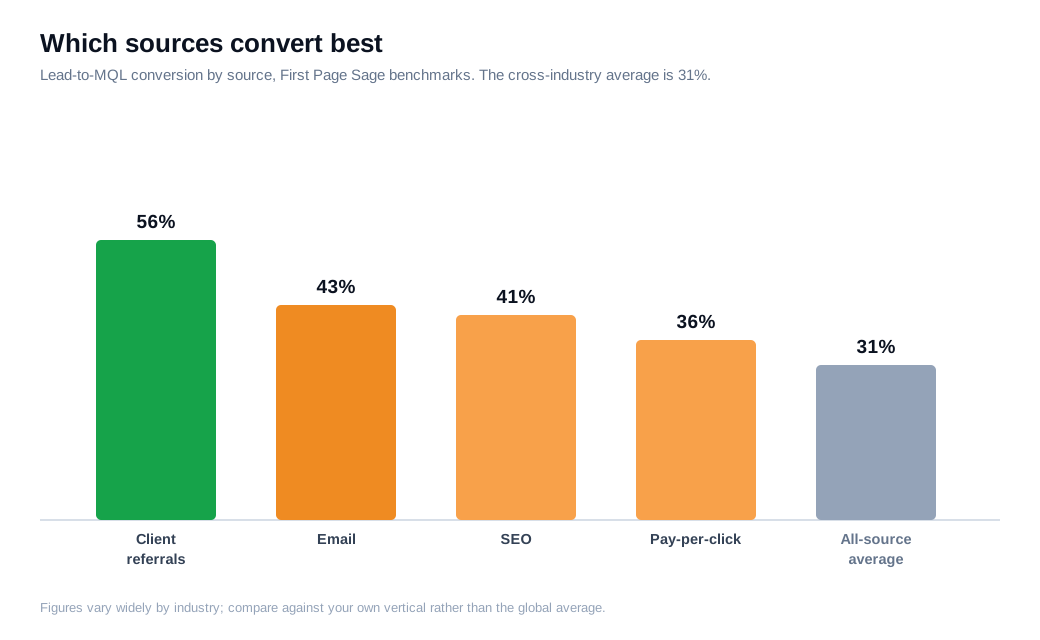
Two cautions before you copy any benchmark. First, compare against your own industry, not the global average. A 6 percent organic rate is excellent in B2B tech and mediocre in professional services. Second, high conversion does not always mean high volume. Referrals convert beautifully but rarely scale on command, so the practical goal is a mix: keep the high-converting sources fed and work on lifting the high-volume ones.
How do you reallocate budget by source?
Reallocate budget by ranking sources on cost per customer and revenue, not cost per lead, then shifting money from the channels that produce expensive customers to the ones that produce cheap, high-quality customers. Conversion rate is the hinge that connects the two numbers.
Work an example. Say you spend across four sources in a quarter and track each one all the way to closed customers.
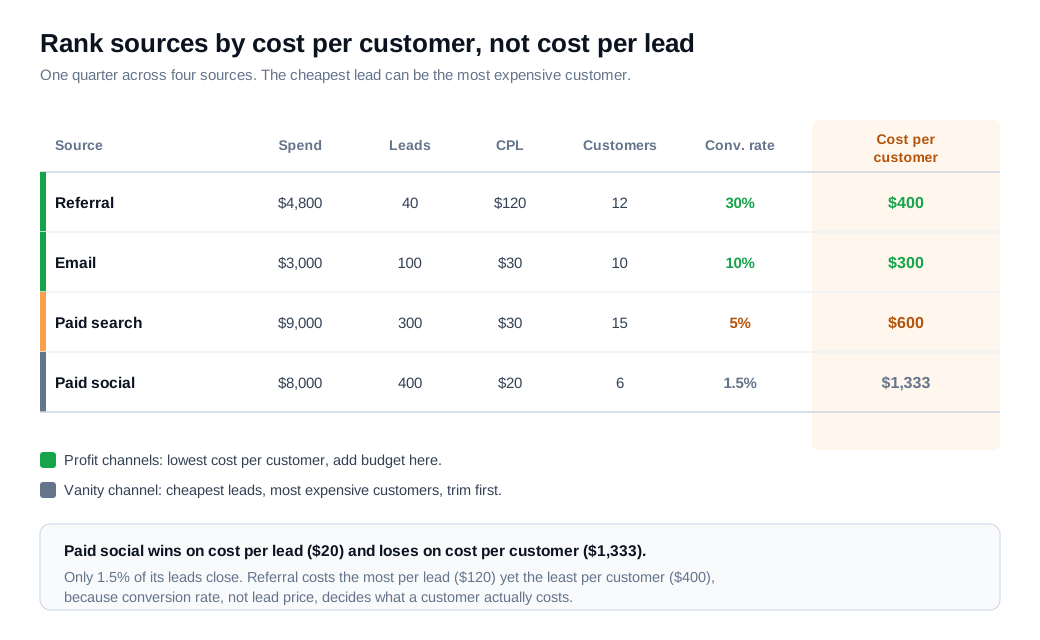
Read the table by the last column. Paid social has the lowest cost per lead ($20) yet the highest cost per customer ($1,333), because only 1.5 percent of its leads close. Referrals cost the most per lead ($120) and the least per customer ($400). Ranked by cost per customer, referral and email are your profit channels and paid social is the vanity channel: plenty of leads, little revenue.
A simple rule keeps the reallocation honest. Move budget toward the top quartile of sources by return, in the range of 15 to 25 percent more, and cut the bottom quartile by 30 to 50 percent unless it serves a documented purpose such as brand reach or feeding the top of the funnel. Email frequently posts one of the highest returns of any channel, often cited near $36 for every $1 spent, which is why it usually survives these cuts. Revisit the numbers quarterly, since conversion rates by source drift as campaigns, creative, and seasonality change.
One caveat on cutting. A channel can convert poorly at last touch and still start many journeys that close elsewhere. Check its first-touch contribution before you zero it out, or you will starve the top of the funnel and wonder two quarters later why the profit channels dried up.
What mistakes distort conversion by lead source?
The most common mistake is judging a source on too few leads, where one or two lucky deals swing the rate enough to trigger a bad budget call. A source needs a meaningful sample, usually a few dozen conversions, before its rate says anything real. Small numbers are noise wearing the costume of a trend. The fix is a minimum threshold: set a floor, say 30 conversions, and treat any source below it as provisional until it clears the bar.
Three more traps recur. Confusing lead volume with lead quality pushes teams to celebrate the channel with the most form fills even when almost none of them close. Over-relying on last-touch attribution punishes awareness channels that do real work early in the journey. And leaving attribution windows undefined lets the same customer get counted under whichever source you happened to look at last. Fix these by agreeing on a funnel step, a model, and a window, then holding all three steady long enough to compare like with like.
This is also where fast response and clean routing pay off. High-intent sources such as referrals and demo requests convert best when someone reaches the buyer quickly, so routing those leads to the right rep and offering a real-time channel like live chat or a live video call turns a good source into a better one. For inbound sales teams, the source data and the follow-up motion are two halves of the same system, and tightening lead routing and notifications is often the cheapest conversion gain on the board.
Key takeaways
- Segment before you average. A blended conversion rate hides which sources create revenue and which only create volume, and the source-level split is where the real budget decisions live.
- Fix tracking first, then pick a model. Capture UTMs into CRM fields and add a self-reported source field, then commit to one attribution model (first-touch, last-touch, or multi-touch) and keep it consistent every period.
- Judge sources on cost per customer, not cost per lead. A cheap lead from a channel that never closes is your most expensive customer, and conversion rate is what turns one metric into the other.
- Benchmark against your own industry. Referrals and email tend to convert highest, with First Page Sage putting referrals at 56 percent lead-to-MQL, but every number swings by vertical, so compare against your vertical.
- Reallocate on a schedule, and check first touch before cutting. Add to the top quartile, trim the bottom, but confirm a weak last-touch channel is not quietly starting journeys that close somewhere else.
- Protect against small samples. Wait for a few dozen conversions per source before you trust a rate, or you will chase noise into a bad decision.
TAGS

Written by
Daniel SemeckyCo-founder & CEO
Daniel is the co-founder and CEO of Glimpze. He spends his days talking to revenue teams about how to catch high-intent visitors before they bounce, and writes about inbound sales, lead conversion, and building a motion where marketing and sales actually share a number.


