
On this page
A finance leader can look at a customer success budget and see nothing but cost: salaries, software seats, a few conference tickets, and travel. What the line item hides is the revenue that never walked out the door, the accounts that grew instead of shrank, and the referrals that arrived with no marketing spend behind them. Customer success earns its keep on the far side of the ledger, where the money is real but rarely counted against what the team costs to run.
Measuring the return turns that argument from a feeling into a figure. The same math that convinces a board also keeps a team honest, because it exposes the activities that produce no revenue as clearly as the ones that do. Treated well, customer success ROI is something you can calculate, defend, and put on a slide.
This post covers what returns customer success actually creates, how to calculate the ROI with a worked example, how to tie the work to retention and expansion, which metrics prove the value, and how to present the number so a finance leader believes it.
What returns does customer success create?
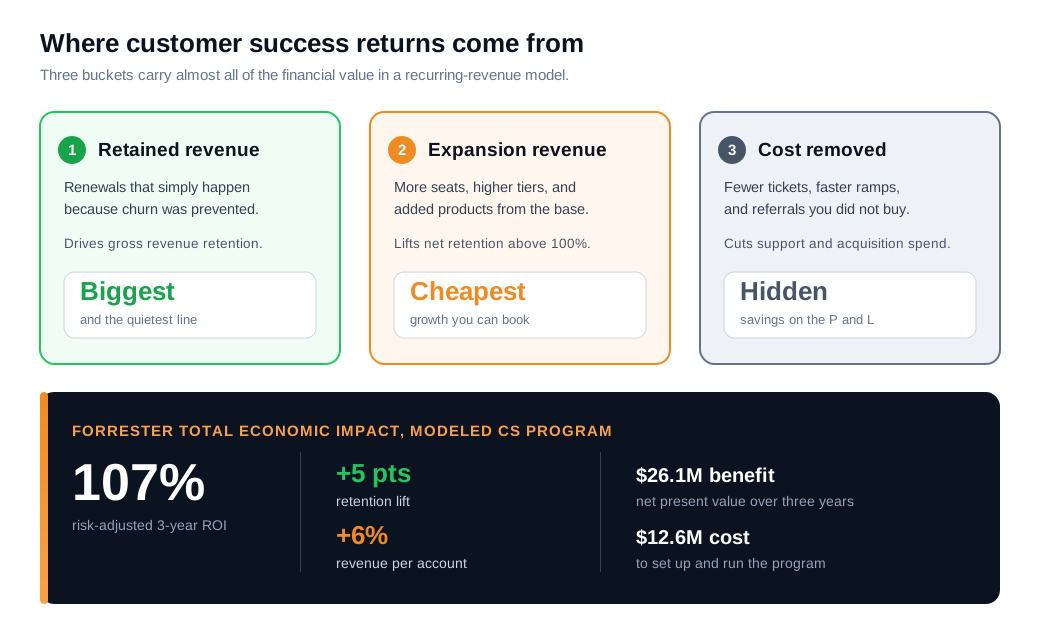
Customer success creates returns in three places: revenue it keeps from churning, revenue it grows inside existing accounts, and cost it strips out of the rest of the business. In a subscription model those three cover most of the money a company will ever collect, because the first sale is only the opening payment in a long stream that success work protects and extends.
The size of the prize is well documented. Bain research summarized by Harvard Business Review found that raising retention by 5 percent can lift profits by 25 to 95 percent, and that winning a new customer runs five to 25 times more expensive than keeping one you already have. Retention behaves like a profit lever, and few acquisition channels return as much per dollar spent.
Forrester put a controlled number on the function itself. Its Total Economic Impact analysis of a modeled customer success program found a net present benefit above 26.1 million dollars over three years against roughly 12.6 million dollars in cost, a risk-adjusted return of 107 percent. The gains traced to four sources: a five-point lift in retention, a six percent increase in revenue per account from cross-sell and upsell, higher new-customer conversion, and a lighter support load.
Those four sources sort neatly into three buckets. Retained revenue is the biggest and the quietest, because a renewal that simply happens looks like nothing on a dashboard while a cancellation looks like a crisis. Expansion revenue is the growth the base produces on its own, through more seats, higher tiers, and added products. Cost savings show up as fewer support tickets, shorter ramp times, and the marketing budget you did not spend because a happy customer sent a referral instead.
How do you calculate customer success ROI?
You calculate customer success ROI by subtracting what the program costs from the financial gain it produces, dividing by that same cost, and multiplying by 100. The formula is the standard return calculation: ROI equals gains from customer success minus cost of customer success, all divided by cost of customer success, written as a percentage.
The cost side is the easy half. Add fully loaded salaries for the customer success team, the software they run on, enablement and training, and any allocated overhead. A four-person team with tooling often lands somewhere near 800,000 dollars a year once benefits and platforms are counted.
The gain side is where measurement gets honest or dishonest. The gain is the incremental revenue customer success is responsible for, meaning the retained and expansion dollars that would not have appeared without the team. Crediting the entire renewed base to customer success inflates the number past the point any finance partner will trust, so the defensible version compares results against a counterfactual: the retention and expansion an unmanaged book produced before the team existed, or produces today in a segment the team does not touch.
Here is the worked math. A customer success team manages a book of 8,000,000 dollars in ARR and costs 800,000 dollars a year to run. Gross retention on the managed book holds at 91 percent, against a measured 83 percent baseline in the unmanaged segment, an eight-point difference worth 640,000 dollars of ARR that would otherwise have churned. The same accounts expanded by 700,000 dollars, and the unmanaged baseline would have produced only about 140,000 dollars of that, leaving 560,000 dollars of expansion credited to the team.
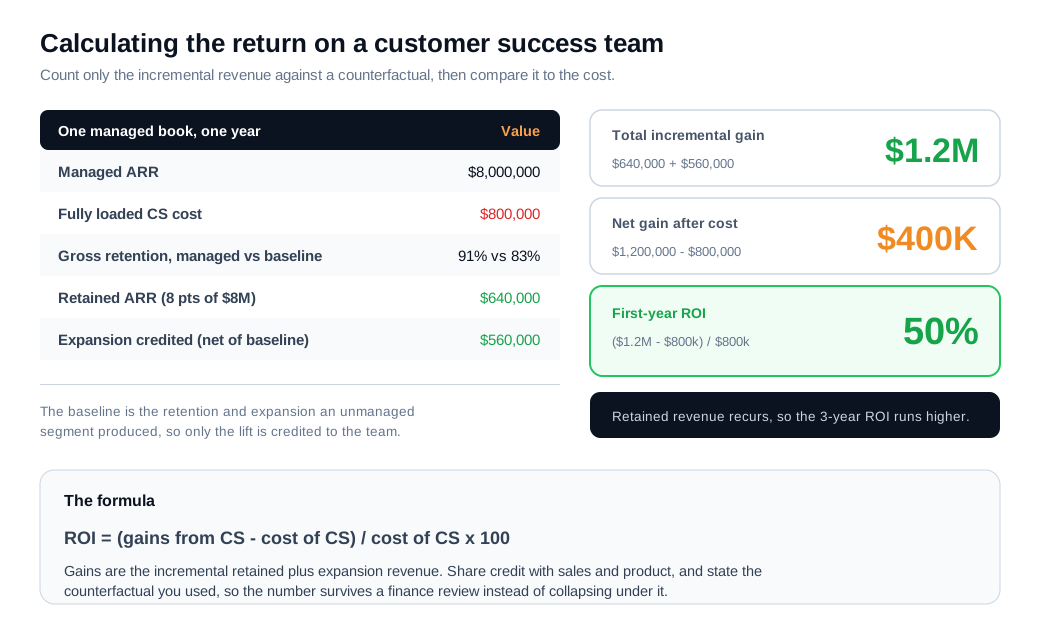
Add the two incremental pieces and the gain is 1,200,000 dollars. Subtract the 800,000 dollars of cost, divide by that cost, and the ROI is 50 percent in a single year. Because retained revenue recurs, a three-year view of the same accounts compounds well past that first-year figure, which is why Forrester's modeled program reaches 107 percent over three years rather than one.
One caution keeps the figure credible. Attribution is a spectrum, and a customer success manager rarely acts alone on a renewal or an upsell. Sharing credit with sales and product, and stating the counterfactual you used out loud, earns more trust than a suspiciously clean number that assumes the team did everything.
How do you tie CS to retention and expansion?
You tie customer success to retention and expansion by mapping each activity to the part of net revenue retention it moves, so onboarding and adoption work reads as gross retention while renewal and whitespace work reads as expansion. Net revenue retention is the bridge that connects the daily work to the financial result.
Start with the two retention numbers, because they split the work cleanly. Gross revenue retention counts only the revenue you keep after churn and downgrades and can never top 100 percent, so it measures the floor customer success defends. Net revenue retention adds expansion back in and can run well above 100 percent, so it measures whether the base grows. Gainsight argues both belong in front of a board together, because the gap between them shows whether retention strength is spread across the base or propped up by a few expanding accounts.
Map the activities onto the bridge. Onboarding that drives a new account to its first real outcome protects gross retention, since most churn is set in the first 90 days before a customer ever reaches value. Health scoring and proactive outreach catch the accounts drifting toward the exit, which again defends the floor. Quarterly business reviews, whitespace analysis, and renewal conversations are where expansion lives, moving net retention above 100 percent by turning a satisfied account into a larger one.
A quick worked bridge shows the shape. Take a cohort worth 5,000,000 dollars in ARR. Over a year customer success holds churn to 200,000 dollars and contraction to 100,000 dollars, while driving 550,000 dollars of expansion. Gross retention is 5,000,000 minus 300,000, over 5,000,000, or 94 percent. Net retention is 5,000,000 minus 300,000 plus 550,000, over 5,000,000, or 105 percent. The 11-point gap between the two is the expansion the team produced, and it is the clearest single line proving the function grows revenue rather than only guarding it.
Where those conversations happen matters to both numbers. An account stuck on a problem that has to file a ticket and wait is an account drifting toward churn, while one that reaches a person over live chat or a quick screen share gets unblocked before frustration hardens into a cancellation. Routine questions handled by an AI chat assistant free the customer success team to spend its hours on the renewals and expansions that move the ROI number, rather than on password resets.
What metrics prove CS value?
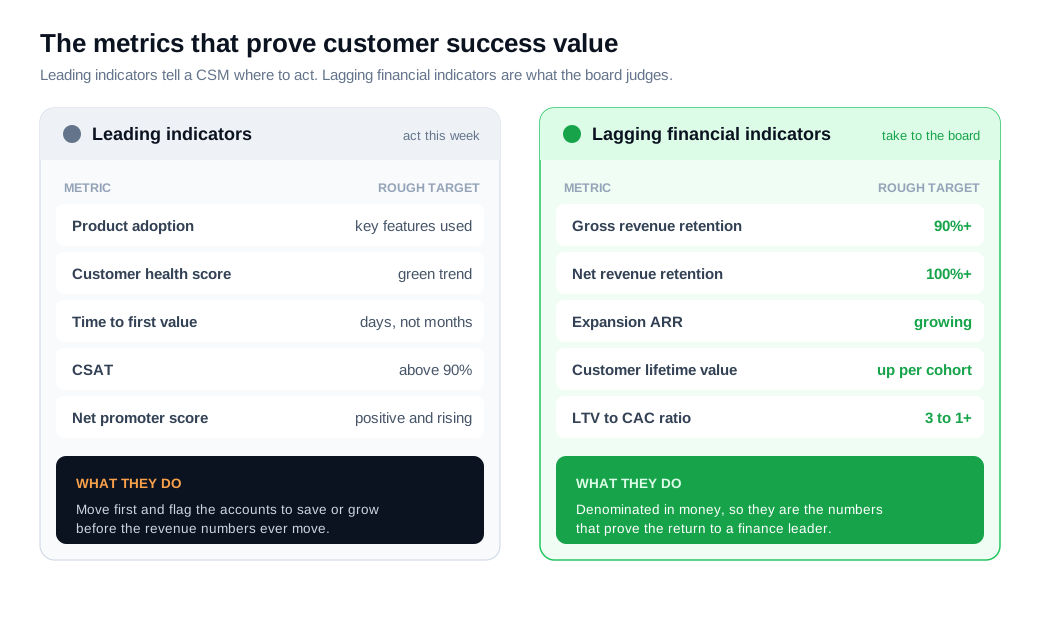
The metrics that prove customer success value are the financial ones a CFO already tracks: gross revenue retention, net revenue retention, customer lifetime value, and the ratio of lifetime value to acquisition cost. Softer measures like adoption and satisfaction matter as early warnings, and they persuade a finance leader only once they connect to those revenue lines.
Split the metrics into leading and lagging, because they do different jobs. Leading indicators, including product adoption, health scores, customer satisfaction, and net promoter scores, move first and tell a customer success manager where to act this week. Lagging indicators, including gross retention, net retention, churn, expansion ARR, and lifetime value, move later and are what you take to the board, because they are denominated in money.
Customer lifetime value ties the retention work to a dollar figure per customer. A common SaaS version divides average revenue per account, adjusted for gross margin, by the churn rate, so an account paying 12,000 dollars a year at an 80 percent gross margin and a 10 percent annual churn rate is worth 96,000 dollars in lifetime gross profit. Set that lifetime value against the cost to acquire the customer, and the ratio matters: a healthy SaaS business aims for a lifetime-value-to-acquisition-cost ratio of about 3 to 1 or better, and every point of churn customer success removes lengthens the lifetime and lifts the ratio.
Expansion metrics deserve their own line because expansion is cheap growth. The often-cited figures from the book Marketing Metrics put the probability of selling to an existing customer at 60 to 70 percent against 5 to 20 percent for a new prospect, and HubSpot's research on acquisition costs shows how expensive winning a new logo has become. Expansion ARR sourced or influenced by customer success captures that advantage in a single number a revenue leader can act on, and ChurnZero's rundown of the revenue metrics that matter puts net retention and expansion at the top of the list.
How do you present CS ROI?
You present customer success ROI by translating the work into the financial language the audience already speaks, leading with retained and expansion revenue, showing gross and net retention side by side, and stating the ROI as a single defensible percentage. A board does not want activity counts. It wants to know whether the function returns more than it costs.
Open with the outcome, then the math. State the ROI figure and the counterfactual behind it in one line, the way the worked example above does, so the number lands before the detail arrives. Then show gross and net retention together, because the pair tells the whole story: gross retention proves you are defending the base, and net retention above 100 percent proves the base is growing.
Make the compounding explicit. A single point of gross revenue retention builds into more enterprise value several years out than a large one-time jump in new-logo bookings, because retained revenue recurs while a bookings bump does not. Framing a retention gain in that currency reframes customer success from a support cost into a driver of the multiple the company trades at, a point TSIA makes in its guide to customer success ROI.
Keep the presentation short and tied to company goals. Lead each section with the business outcome, use tailwinds and headwinds to frame what is working and where the pressure sits, and bring one or two concrete account stories to make the number human: an expansion that grew out of a quarterly review, a churn avoided because a health score fired in time. A tight, financially framed story in under 20 minutes beats an hour of dashboards, and it is what turns customer success from a line a finance team wants to cut into one it wants to fund.
Key takeaways
- Customer success returns land in three buckets, retained revenue, expansion revenue, and stripped-out cost, and Forrester modeled a 107 percent three-year ROI on a program with a five-point retention lift and a six percent revenue-per-account bump.
- The ROI formula is simple and the honesty is the hard part, since the gain is the incremental retained and expansion revenue measured against a counterfactual, never the entire renewed base credited to the team.
- A worked book of 8,000,000 dollars with an eight-point retention lift and 560,000 dollars of credited expansion returns 50 percent in year one, and more over three years as retained revenue recurs.
- Net revenue retention is the bridge, with gross retention measuring the floor customer success defends and net retention above 100 percent measuring the growth it drives on top of that floor.
- Lead the board with financial metrics, gross and net retention, lifetime value, and a lifetime-value-to-acquisition-cost ratio near 3 to 1, keeping adoption and satisfaction as the early warnings behind them.
- Present the number in the audience's language, one defensible ROI figure with its counterfactual, gross and net retention side by side, and a short story that ties a dollar outcome to the work that produced it.

Written by
Nilas MylerCo-founder & CTO, Glimpze
Nilas is the co-founder and CTO of Glimpze, an inbound sales tool that turns high-intent website visitors into live conversations. A former SEO consultant for some of the largest companies in Denmark, he writes about speed-to-lead, inbound sales, and conversion rate optimization — the technical and operational mechanics of turning traffic into pipeline.


