
On this page
A CRO asks the new RevOps hire a simple question at the end of the first quarter: what did you actually change? The answer is a dashboard with forty charts. Pipeline is up, but pipeline was up last year too. Response times look better on one report and worse on another. Fifteen minutes in, the CRO still cannot tell whether the function paid for itself, because nothing on the screen ties back to a dollar.
That is the measurement problem RevOps runs into more than any other. The function sits across marketing, sales, and customer success, so its wins live in the seams that no single team reports on. If you cannot name the number RevOps moved and the revenue that number produced, the budget is on borrowed time.
This post covers what RevOps success actually looks like, the metrics that prove the function's value, the benchmarks worth aiming for, how to connect those metrics to revenue, how to report the results to leadership, and the mistakes that make RevOps numbers look better or worse than they are.
What does RevOps success look like?
RevOps success looks like a revenue engine that is faster, more predictable, and more efficient than it was before the function existed, measured by movement in a small set of cross-team numbers rather than by activity. The dashboard is not the outcome. The outcome is a leader who can trust the forecast and plan headcount and spend against it.
Three dimensions carry most of the signal. Speed shows up in sales cycle length and lead response time. Predictability shows up in forecast accuracy, the single metric that decides whether anyone believes the rest of your reporting. Efficiency shows up in win rate, funnel conversion, and customer acquisition cost. When all three move in the right direction over two or three quarters, the function is working, whatever the org chart says.
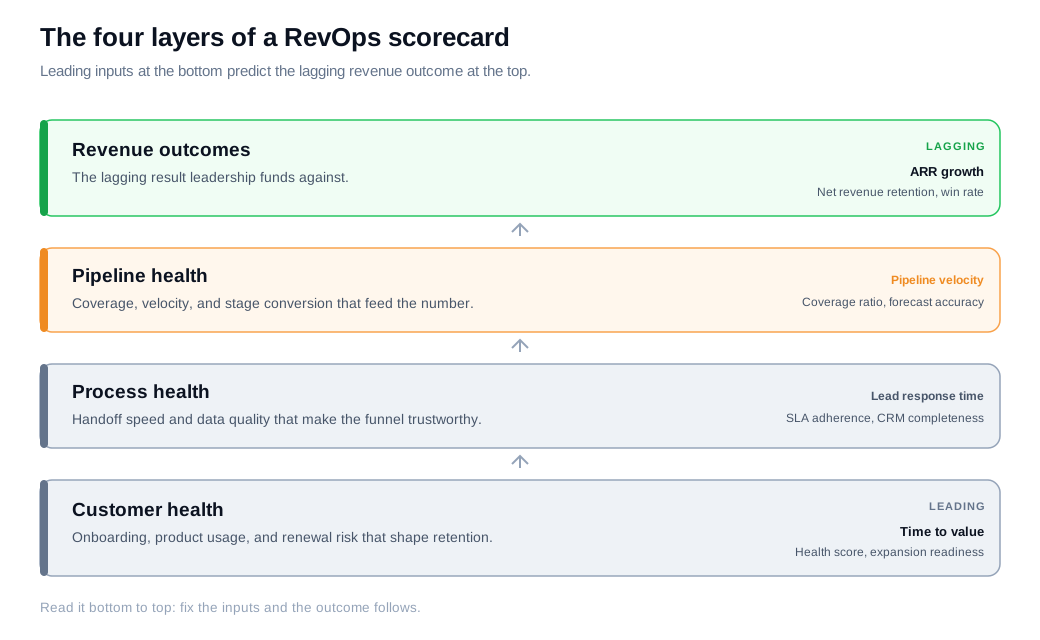
A useful way to organize the picture is a scorecard with four layers, a structure most RevOps dashboards converge on. Customer health and process health are the leading inputs at the bottom. Pipeline health sits above them. Revenue outcomes sit at the top as the lagging result. The point of the stack is that you fix the bottom to move the top, and you can watch the inputs change weeks before the revenue number confirms it.
Success is also a trend, not a snapshot. A single strong quarter can come from a lucky deal or a market tailwind. What proves the function is the same numbers holding up across quarters while the inputs you control keep improving.
What metrics prove RevOps value?
The metrics that prove RevOps value are the cross-functional ones no single team can move alone: pipeline velocity, forecast accuracy, funnel conversion by stage, net revenue retention, lead response time, and customer acquisition cost. Each one spans a handoff, which is exactly why RevOps owns it and why moving it requires more than one team to cooperate.
Here is what each one tells you:
- Pipeline velocity: how fast revenue moves through the funnel, calculated as (number of opportunities times average deal value times win rate) divided by the sales cycle length. It rolls four levers into one number.
- Forecast accuracy: actual revenue divided by forecasted revenue, expressed as a percentage. It measures whether the company can trust its own predictions.
- Funnel conversion by stage: the share of leads and opportunities that advance from one stage to the next. It shows exactly where the funnel leaks.
- Net revenue retention: the recurring revenue kept from existing customers after churn, contraction, and expansion. Above 100% means the base grows without a single new sale.
- Lead response time: minutes from an inbound lead to first human contact. It connects marketing's output to sales' follow-through.
- Customer acquisition cost: the fully loaded cost to win one customer. It keeps the growth honest by pricing in what the pipeline costs to produce.
Highspot's rundown of revenue operations KPIs and Default's list of RevOps metrics both land on a similar core, and both make the same warning: do not track all of them at once. Pick the two or three that explain your biggest revenue problem this quarter and report those with a trend line.
Here is a worked example on pipeline velocity. A team has 80 open opportunities, an average deal size of $18,000, a 22% win rate, and a 72-day sales cycle. Velocity is (80 times 18,000 times 0.22) divided by 72, which is about $4,400 per day. If RevOps trims the cycle to 60 days by fixing a stalled legal-review handoff, the same inputs produce roughly $5,280 per day, a 20% lift in how fast revenue moves with no new pipeline created. That gain came entirely from a process the function owns.
What are healthy benchmarks for RevOps metrics?
Healthy benchmarks give you a target to steer toward: forecast accuracy within 10% of actual, pipeline coverage of at least 3x the next quarter's target, net revenue retention above 110%, and a lead response time measured in minutes rather than hours. These are directional numbers from B2B SaaS, so treat them as a compass and weight your own trend line more heavily.
Prospeo's and Landbase's benchmark write-ups line up on the headline figures. Forecast accuracy should land inside 10% of actual results, and the strongest teams forecast inside 5%. Pipeline coverage of 3x is the floor, with 4x to 5x as the target, and anything under 3x is an early warning that the quarter is at risk. Win rates cluster around 20% to 30% for B2B SaaS, with enterprise deals closing lower and SMB deals higher. Net revenue retention above 110% marks a base that expands on its own.
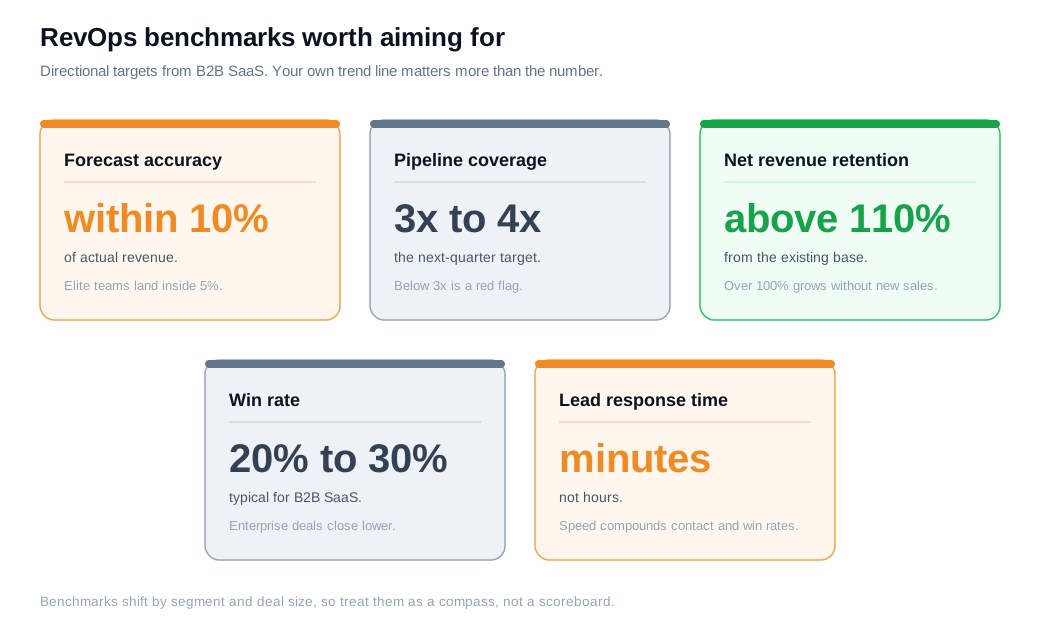
Benchmarks shift by segment, deal size, and motion, so a number that is excellent for enterprise can be mediocre for SMB. The more reliable read is your own baseline. If forecast accuracy was 78% two quarters ago and it is 91% now, that improvement is the proof, regardless of where a benchmark table puts the bar.
How do you tie RevOps to revenue?
You tie RevOps to revenue by isolating the specific process you changed, measuring the metric before and after, and translating the improvement into dollars using the funnel math the business already runs. The chain has to be legible: this process moved, that metric moved, and here is the revenue the movement produced.
Speed to lead is the cleanest example, because the cause and effect are short. Classic Harvard Business Review research, The Short Life of Online Sales Leads, found that firms contacting a web lead within an hour were far more likely to reach a decision-maker, and up to 60 times more likely to qualify the lead, than those who waited a full day. Cut response time and you raise the contact rate, and a higher contact rate flows straight into more deals.
Put numbers on it. Say the site produces 500 qualified leads a month, and slow follow-up means only 60% ever get contacted. RevOps ships automated routing and notifications so hot leads reach the right rep in minutes, and the contact rate climbs to 90%. That is 150 more leads reached each month. At an 8% lead-to-deal rate and a $15,000 average contract, those 150 contacts turn into roughly 12 deals worth about $180,000 in new business, from a process change rather than more ad spend. Fast conversations in the moment interest peaks are also what a real-time channel like live chat is built for, which is why response time sits at the center of any serious inbound sales motion.
Two disciplines keep the attribution honest. Set a baseline before you change anything, so the before-and-after is real rather than remembered. And separate the lift you caused from the market you rode; if the whole category grew 15% that quarter, do not book all of it against RevOps. Careful attribution builds the credibility that the reporting depends on.
How do you report RevOps results to leadership?
You report RevOps results to leadership with a short, curated narrative built on five to seven metrics that connect leading inputs to revenue outcomes, plus the risks you see and one clear recommendation. A board report and an operating dashboard do different jobs, and confusing them is how RevOps loses the room.
A board report is not a bigger dashboard. Guides from Activated Scale and Weflow both frame it the same way: internal dashboards run pipeline movement and rep activity day to day, while board reporting answers a smaller, harder set of questions. How reliable is growth, what is putting the plan at risk, and what should leadership do about it. Answer those in a curated story with trend lines, not a live walkthrough of forty charts.
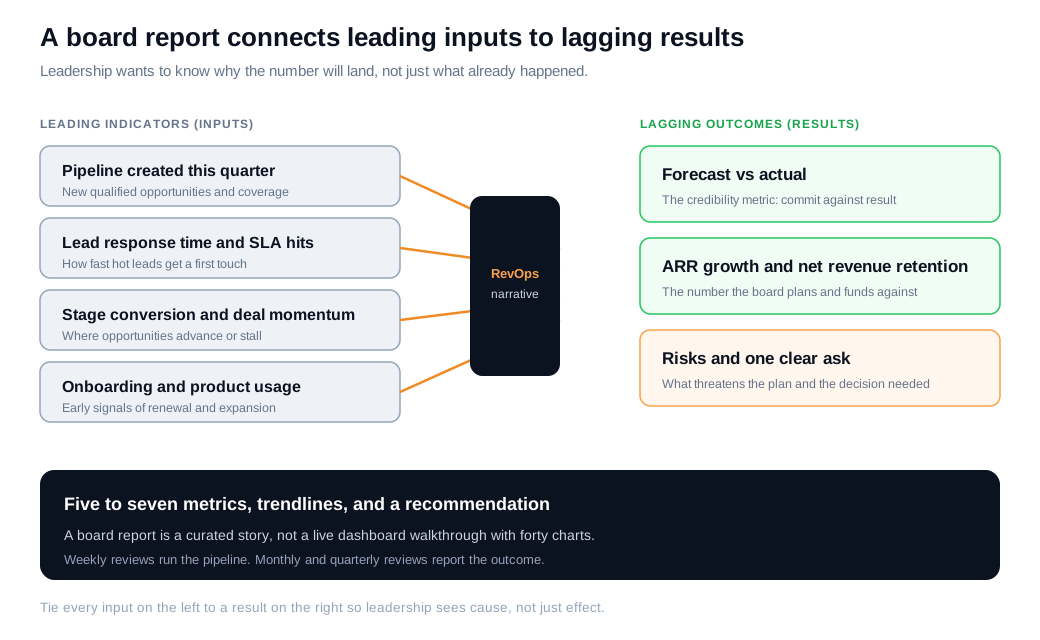
The structure that lands connects leading indicators to lagging outcomes. Lagging metrics like ARR, net revenue retention, and closed revenue show what already happened. Leading metrics like pipeline created, ramp time, stage conversion, and lead response time predict what will happen next. Report them together so the board can see the cause behind the coming quarter's number, with the leading inputs shown next to the lagging results they drive.
Forecast accuracy deserves its own line, because it is the credibility metric. If your commit is consistently off, leadership stops trusting every other number you present, and the function's influence goes with it. Boards do not expect a perfect forecast. They expect early visibility into risk, which deals are slipping, why, and what management is doing about them.
Cadence separates the two audiences. RevOps runs a weekly pipeline review with sales and marketing ops that spends a few minutes per KPI on metric, trend, variance, and action. Leadership gets a monthly or quarterly review that reports the outcome, explains the variance, and closes with a single recommendation the executives can act on.
What are the common mistakes in measuring RevOps success?
The common mistakes are tracking too many metrics, reporting activity instead of outcomes, taking credit for trends RevOps did not cause, and letting definitions drift so the same metric means different things to different teams. Each one quietly erodes the trust that makes the numbers useful.
The vanity-metric trap is the most frequent. A dashboard with forty tiles feels thorough and tells leadership nothing, because no one can say which tile to act on. Fewer metrics with a clear trend beat a wall of charts every time. Reporting activity has the same flaw: tickets closed and tools deployed are inputs, and leadership funds outcomes, so a rise in activity that does not move a revenue metric is overhead dressed up as progress.
The credibility mistakes are subtler and more damaging. Claiming a market tailwind as a RevOps win works once, until the tide goes out and the numbers expose it. Definition drift is worse, because it is invisible: if marketing counts a qualified lead by one rule and sales by another, every downstream number is built on sand. This is where clean, shared data earns its keep, and it is why the discipline overlaps so heavily with CRM hygiene and a single source of truth. Agree on the definitions, enforce them in the system, and the same metric finally means one thing across the whole revenue team.
Key takeaways
- Success is movement, not a dashboard. RevOps works when the revenue engine gets faster, more predictable, and more efficient across two or three quarters, measured by a small set of cross-team numbers.
- Own the metrics that span handoffs. Pipeline velocity, forecast accuracy, funnel conversion, net revenue retention, lead response time, and CAC prove value precisely because no single team can move them alone.
- Use benchmarks as a compass. Aim for forecast accuracy within 10%, pipeline coverage above 3x, and net revenue retention over 110%, but weight your own baseline trend more than any benchmark table.
- Translate every win into dollars. Isolate the process you changed, measure before and after, and run the improvement through your funnel math so the revenue impact is legible.
- Report a story, not a spreadsheet. Connect leading inputs to lagging outcomes with five to seven metrics, name the risks, and close with one recommendation leadership can act on.
- Protect your credibility. Forecast accuracy is the trust metric, so never claim a market tailwind as a RevOps win and never let metric definitions drift between teams.

Written by
Daniel SemeckyCo-founder & CEO
Daniel is the co-founder and CEO of Glimpze. He spends his days talking to revenue teams about how to catch high-intent visitors before they bounce, and writes about inbound sales, lead conversion, and building a motion where marketing and sales actually share a number.


