
On this page
A sales leader tells the board the quarter will land at $4.2 million. It closes at $3.6 million. No one lied. In week two the pipeline looked full, then three large deals slipped to the following quarter and a discount nobody had modeled trimmed the rest. The board still remembers the $4.2 million.
That gap is a forecasting problem, and it is ordinary. Gartner found that fewer than half of sales leaders and sellers have high confidence in their own forecast. A number that misses by a wide margin does more than embarrass a leader, because hiring plans, spending, and cash decisions all get made against it before anyone knows it was wrong.
This post covers what revenue forecasting is, why forecasts miss so often, which methods actually improve accuracy, how to measure the error properly, how to shrink it, and where revenue operations fits in.
What is revenue forecasting?
Revenue forecasting is the practice of predicting how much revenue a business will book over a future period, usually a month, quarter, or year, based on current pipeline, past performance, and known trends. The output is a single expected number, along with a range around it.
A forecast is a prediction of the most likely outcome, which makes it different from two numbers it often gets confused with. A target or quota is what leadership wants to happen. Raw pipeline is the sum of every open deal, which assumes all of them close. The forecast sits between those two, and its job is to be honest rather than aspirational.
The forecast matters because so many other decisions ride on it. Finance sets the spending plan and cash runway from it. Sales leadership decides whether to hire more reps or slow down. Operations commits to inventory or capacity. When the forecast is reliable, those decisions rest on solid ground. When it swings by 20% every quarter, every plan built on top inherits the same error.
Why are revenue forecasts so often wrong?
Revenue forecasts miss mostly because the data feeding them is dirty and the human judgment on top of it is biased, not because the underlying math is complicated. Both problems are fixable, and both are usually present at once.
Start with the data. Gartner's State of Sales Operations survey found that only 47% of respondents believed their organization had high-quality data, and it named poor data quality as a leading cause of inaccurate forecasts. A forecast is only as good as the CRM under it, so missing fields, duplicate accounts, deals parked in a stage they left weeks ago, and close dates that keep sliding all quietly corrupt the roll-up.
Then add human bias. Reps with "happy ears" mark shaky deals as likely because they want them to be. Others sandbag, lowballing their commit so they can beat it later. A close date gets pushed a week at a time until a deal that will never land still counts in this quarter's number. None of these show up in a spreadsheet total, and they push the forecast in opposite directions, so a roll-up can look reasonable while being wrong in both halves.
What methods improve forecast accuracy?
The methods that most reliably improve accuracy are running a weighted pipeline off real historical close rates, building the forecast both top-down and bottom-up, and reconciling the gap between the two. Each one replaces a guess with something you can check.
A weighted pipeline assigns every open deal a close probability based on its stage, then multiplies deal value by that probability and sums the results. DealHub describes the formula as weighted value equals deal value times stage probability, run across every open opportunity. The point is to stop treating raw pipeline as if all of it will close.
Here is a worked example. Say five deals are open: a $200,000 deal in Proposal at 60%, a $150,000 deal in Demo at 30%, an $80,000 deal at Contract sent at 90%, a $120,000 deal in Discovery at 10%, and a $50,000 deal in Demo at 30%. Raw pipeline reads $600,000. Weighted, it forecasts $264,000.
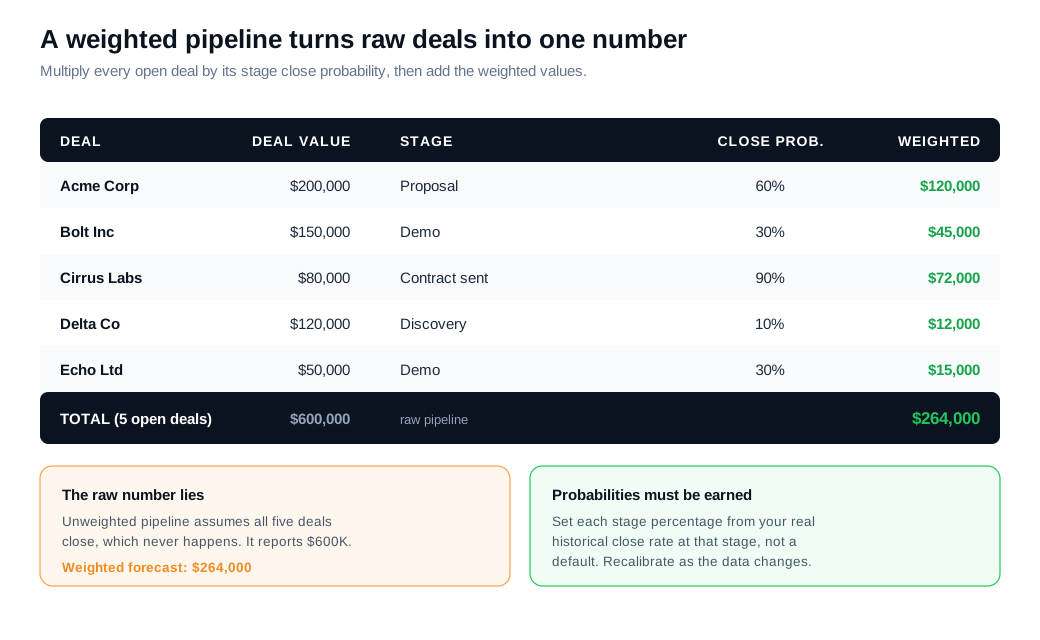
The probabilities have to be earned. Avoma's guide to forecasting methods sets stage percentages from your own historical close rate at each stage rather than a default, so a stage that closes 30% of the time over a meaningful sample gets 30%, not a number someone liked.
Building the forecast two ways adds a second check. Top-down forecasting works from the outside in: leadership sets a revenue goal from growth expectations and breaks it into quotas. Bottom-up works from the inside out, summing deal-level inputs like the weighted pipeline above. Avoma's recommendation is to run both and actively manage the gap, because when the two numbers diverge sharply it flags either an aggressive target, thin pipeline coverage, or a faulty assumption that needs attention. Historical run-rate models and machine-learning forecasts are useful additions, though they still depend on the same clean inputs.
A pipeline coverage ratio is a fast sanity check on any of these. Divide open pipeline for the period by the target, and a common rule of thumb is that you want roughly three times coverage to hit the number, since most of those deals will not close. In the worked example above, $600,000 of raw pipeline against a $300,000 target is only 2x coverage, which is a warning that the quarter is short on deals well before the weighted math confirms it.
How do you measure forecast accuracy?
You measure forecast accuracy by comparing the forecast to what actually closed and scoring the gap two ways: MAPE for the size of the miss and bias for its direction. One number tells you how far off you were, the other tells you which way you lean.
Mean absolute percentage error, or MAPE, is the average of the absolute percentage errors across periods. EazyStock lays out the formula as the absolute value of actual minus forecast, divided by actual, averaged across the periods you are grading. It ignores direction on purpose, so an over-forecast and an under-forecast of the same size count equally.
Bias captures what MAPE hides. Forecast bias is the running sum of forecast minus actual: positive when you tend to over-forecast, negative when you under-forecast. Arkieva notes that a forecast can carry a good accuracy score and still be biased in one direction, which is the pattern worth catching, because a one-way lean is easy to correct once you can see it.
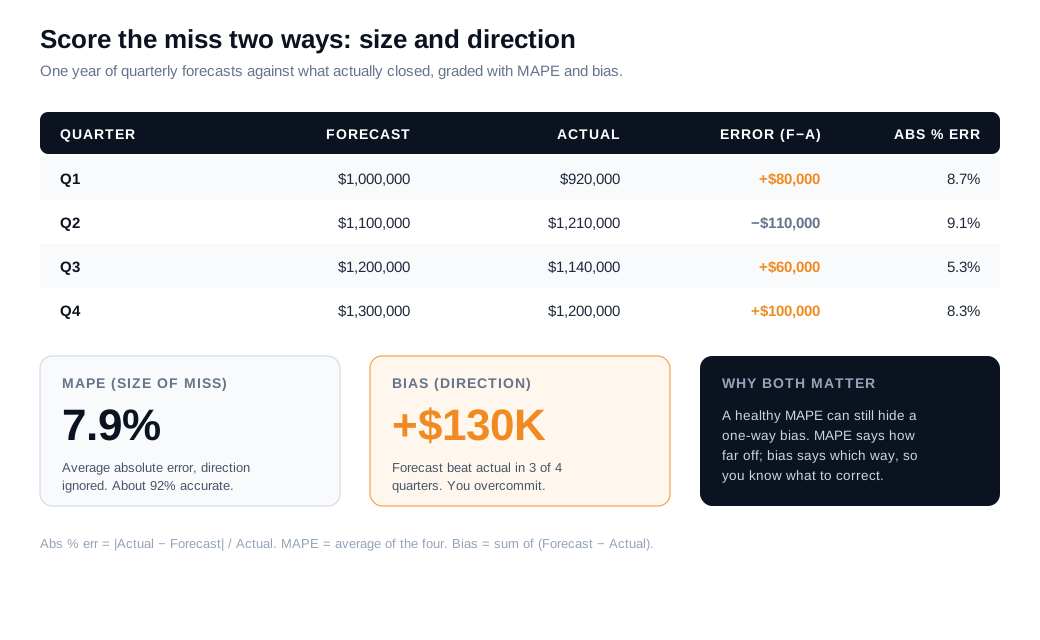
Run a year through it. Quarterly forecasts of $1.00M, $1.10M, $1.20M, and $1.30M land at actuals of $920K, $1.21M, $1.14M, and $1.20M. The absolute percentage errors work out to 8.7%, 9.1%, 5.3%, and 8.3%, for a MAPE of 7.9%, roughly 92% accurate. Yet the forecast beat actual in three of four quarters, a positive bias of $130,000 for the year. The size of the miss looks fine while the team quietly overcommits in every quarter but one.
As for what counts as good, Forrester's grading scale, drawn from its SiriusDecisions research, rates a miss within 5% as excellent, within 10% as good, and beyond 10% as poor. That bar is high in practice. Industry benchmarks compiled by Forecastio put only about one in five sales organizations inside a 10% tolerance, so landing consistently within 10% already puts you ahead of most.
How do you reduce forecast error?
You reduce forecast error by attacking its two sources in order: clean the data first, remove the human bias second, and reach for a fancier model last. Skipping to the model while the inputs are dirty just automates the same wrong answer.
Fixing the data is mostly discipline. Make the fields a forecast depends on required at the point of entry, dedupe accounts, and enforce that a deal cannot sit in a stage it has already left. Set stage probabilities from real historical close rates and recalibrate them as the numbers move, so the weighting reflects how deals behave this year rather than last. Complete pipeline data also depends on capturing every lead in the first place, so a fast inbound sales motion with automated routing and notifications keeps real opportunities from going missing before they ever reach the forecast.
Removing bias is about process and accountability. Split the forecast into clear categories, commit, best case, and pipeline, so a rep's confidence is explicit rather than baked invisibly into one total. Run a regular deal inspection where close dates and next steps get challenged, which drains both the happy-ears optimism and the sandbagging. Then grade each rep's past forecasts with MAPE and bias, and coach the ones who consistently lean one way. A rep who over-forecasts by 20% every quarter is a known, correctable error once someone is watching the pattern.
It also helps to forecast a range rather than a single figure. Reporting a low, likely, and high case tells finance how much uncertainty sits behind the number and stops one point estimate from being treated as a promise. As the quarter progresses and deals resolve, the range narrows, and a forecast that tightens toward actual week over week is a sign the underlying data and judgment are sound.
How does RevOps support forecasting?
Revenue operations supports forecasting by owning the entire loop that produces the number: the data that feeds it, the model that rolls it up, the cadence that inspects it, and the scorecard that grades it afterward. Forecasting breaks down across team seams, and RevOps is the function that owns those seams.
The forecast pulls from sales, marketing, customer success, and finance, and each of those teams defines terms like qualified pipeline and recognized revenue a little differently. Someone neutral has to set one definition, keep the CRM honest, and run the process on a fixed cadence. That work belongs to RevOps, which is why forecast accuracy tends to track how mature a company's revenue operations function is.
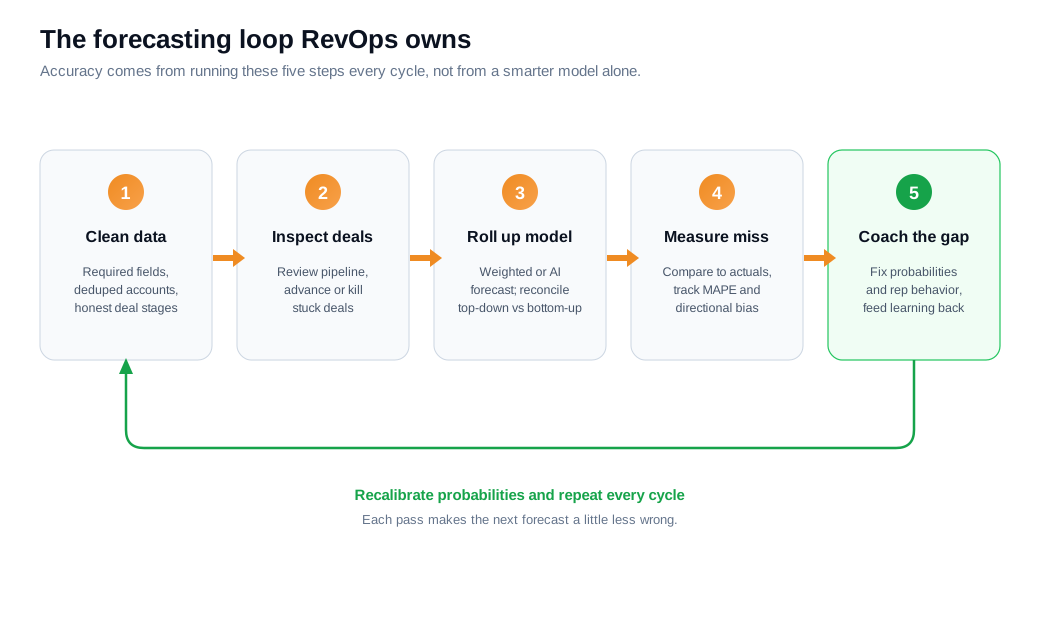
Treating the forecast as a loop is what compounds accuracy over time. Clean the pipeline, inspect the deals, roll up a weighted or model-based forecast, measure the miss against actuals with MAPE and bias, then coach the gap and recalibrate the probabilities before the next cycle. Each pass feeds what it learns back into the inputs, so the model gets a little less wrong every quarter instead of resetting to the same guess. A single reliable forecast also settles the cross-team argument about whose number is right, because everyone is reading the same record.
Key takeaways
- Revenue forecasting predicts booked revenue, and it is separate from targets and raw pipeline. The forecast is the honest expected number, quota is the goal, and raw pipeline assumes every deal closes.
- Most misses come from dirty data and human bias. Gartner found only 47% of teams trust their data quality, while happy ears and sandbagging pull the roll-up in opposite directions.
- Weight the pipeline and forecast both ways. Multiply deals by real historical close rates, build top-down and bottom-up, and reconcile the gap between them.
- Score accuracy with MAPE and bias together. MAPE measures the size of the miss and bias measures the direction, and a good MAPE can still hide a one-way lean.
- Fix the inputs before the model. Clean the CRM, set earned stage probabilities, inspect deals, and coach reps who consistently over- or under-forecast.
- RevOps owns the loop. One neutral function running the data, model, inspection, and scorecard on a cadence is what makes each forecast less wrong than the last.

Written by
Daniel SemeckyCo-founder & CEO
Daniel is the co-founder and CEO of Glimpze. He spends his days talking to revenue teams about how to catch high-intent visitors before they bounce, and writes about inbound sales, lead conversion, and building a motion where marketing and sales actually share a number.


