
On this page
A sales director ranks her team by dials and hands the top spot to the rep who logs 90 calls a day, more than anyone else on the floor. That same rep closed the fewest deals last quarter, and two of her three wins churned inside ninety days.
Busy and productive are different things, and a leaderboard built on raw activity rewards the first while missing the second. The reps who look most active are not always the ones moving revenue, and the quiet closer with the biggest deals sometimes makes the fewest calls.
This post covers what sales rep productivity actually means, which metrics to track, how to compare reps fairly across ramp and territory, and the levers that reliably lift output.
What defines sales rep productivity?
Sales rep productivity is the ratio of useful output a rep generates to the time and resources they consume, so a productive rep turns fewer selling hours and fewer leads into more closed revenue. It measures a rate rather than a total, which is why the rep with the highest raw activity can still be the least productive person on the team.
Both sides of that ratio need a definition. On the output side sit the results that count as real progress: closed revenue, new ARR, and qualified pipeline created. On the input side sit the scarce things a rep spends to get there: selling hours, leads worked, and dollars of pipeline consumed. Productivity rises when output grows against a flat input, or when the same output comes from less input.
The input most managers underestimate is time. Salesforce's State of Sales research found that reps spend only about 28 percent of their week actually selling, with the rest going to admin, data entry, and lead triage. That figure reframes the whole question, because a rep can work flat out and still be unproductive when three of every four hours never touch a live buyer. Most productivity gaps turn out to be time and system problems wearing an effort costume, and the fix usually lives in the process long before it lives in the person.
What sales rep productivity metrics should you track?
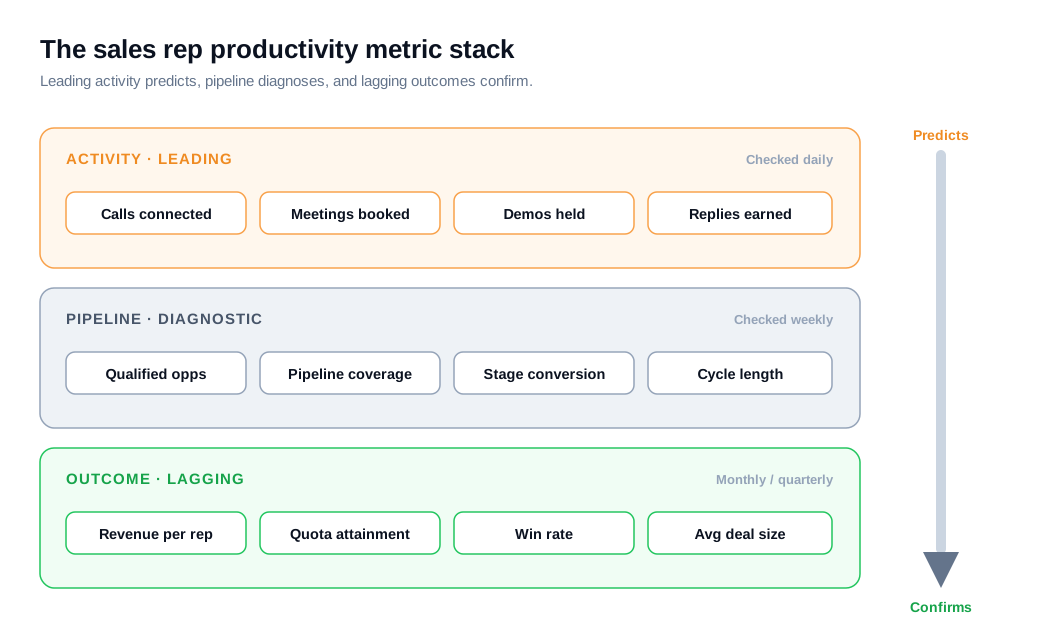
Track a short stack of metrics across three tiers, activity metrics that lead, pipeline metrics in the middle, and outcome metrics that lag, because any single tier on its own tells a partial and usually misleading story. Activity predicts what is coming, pipeline shows where deals are stuck, and outcomes confirm what landed.
The distinction between leading and lagging indicators is the backbone here, and SalesHood frames leading indicators as the real-time coaching opportunities, the rep activities and call connects, that hint at where results are heading. Leading indicators are forward looking and coachable this week. Lagging indicators like revenue and quota attainment report what already happened and cannot be changed. Read together they give a complete picture, and read alone each one lies a little.
A workable stack, close to the sets Mixmax and others publish, looks like this:
- Activity (leading, checked daily): calls connected, meetings booked, demos held, and emails that get a reply.
- Pipeline (checked weekly): qualified opportunities created, pipeline coverage, stage conversion, and sales cycle length.
- Outcome (lagging, checked monthly or quarterly): revenue per rep, quota attainment, win rate, and average deal size.
Revenue per rep is the cleanest single measure of output, and it divides total revenue by the number of quota-carrying reps to show the average each seat produces. Say a team of six closed $1.8 million in a quarter. Revenue per rep is 1.8 million divided by 6, or $300,000 for the period, a definition Revenue.io lays out the same way. That average is a starting benchmark, and the individual version, each rep's own booked revenue, is where coaching begins. Neither number means much until you cut it by tenure and territory, which the next sections handle.
Are activity metrics a good measure of productivity?
Activity metrics work well as early warning signals and poorly as scorecards, because the moment you rank or pay people on raw activity, they optimize the number instead of the result. Dials and emails are inputs, and an input only matters to the degree it converts into a conversation and then a deal.
The trap is the vanity metric. A rep can hit 90 dials a day and look like a machine on the leaderboard while barely reaching a live prospect, and the analysts at Databox make the point that you have to dig past surface counts like calls made and emails sent to see real productivity. The fix is to judge activity by yield rather than volume, so you track connect rate, meetings per hundred dials, and opportunities per demo instead of the naked totals.
Here is the difference in numbers. Rep A makes 90 dials a day at a 4 percent connect rate, which is about 3.6 real conversations. Rep B makes 45 dials at a 12 percent connect rate, which is 5.4 conversations from half the volume. A leaderboard ranked by dials crowns Rep A. A leaderboard ranked by conversations, the thing that actually precedes revenue, crowns Rep B, and it points every other rep toward better lists and better talk tracks instead of more noise.
How do you compare reps fairly?
You compare reps fairly by normalizing for the things they did not choose, mainly ramp stage and territory quality, and then reading the distribution instead of a single average. A raw leaderboard punishes the new hire and the rep who inherited a thin patch, and it quietly flatters whoever drew the best accounts.
Ramp is the first adjustment. A new seller does not perform like a tenured one, and Xactly puts typical ramp time at three to nine months to full productivity depending on role and deal complexity. Measuring a rep in month four against a veteran's full quota manufactures a false gap, so ramping reps should be read against a stepped-down target that rises as they season.
Territory is the second. When a top-down number is split evenly across reps without checking account density or market size, the rep with the sparse patch starts underwater on day one, a pattern SPOTIO ties directly to thin territories sitting in a low attainment band. Normalize by the opportunity each rep was handed before you compare their output.
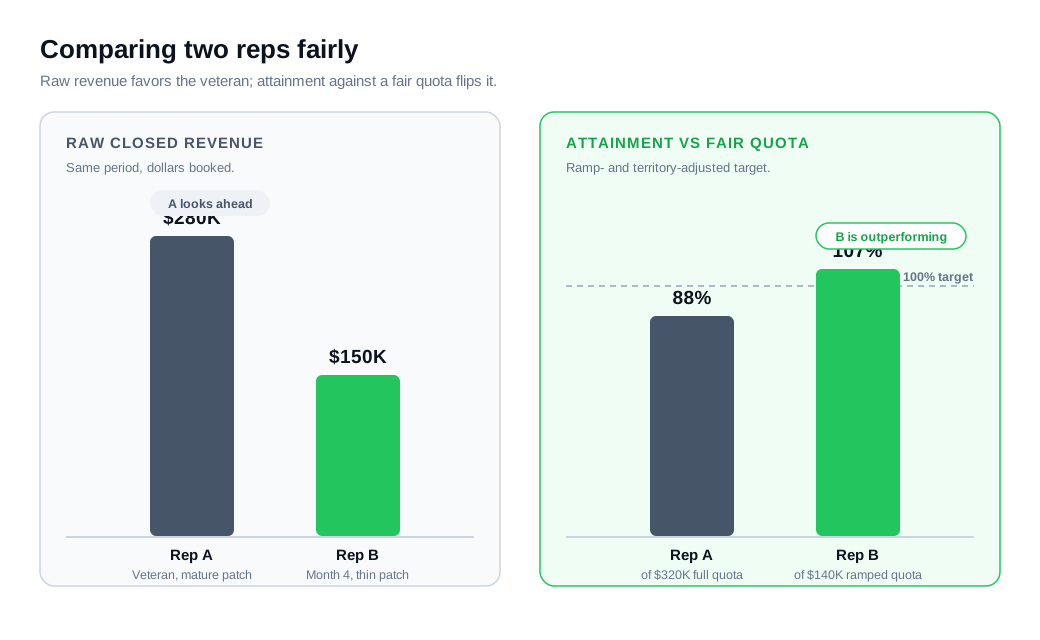
A worked example shows how the ranking flips. Rep A is tenured with a mature territory and closed $280,000. Rep B is in month four, ramping, on a thinner patch, and closed $150,000. Raw revenue says A is far ahead. Now measure each against the target they were actually set: Rep A carried a full $320,000 quota and reached about 88 percent, while Rep B carried a ramped $140,000 quota and reached about 107 percent. Against a fair bar, the newer rep is the one overperforming, and a raw leaderboard would have coached exactly the wrong person.
Then read the spread rather than the mean alone. A team can average a healthy number while one rep sits far below it, and that tail is where the coaching and the turnover risk live. Comparison is a tool for finding who needs help and what to teach, and it only works when the starting lines are drawn honestly. A clean inbound sales motion, where every rep gets a fair shot at high-intent traffic, keeps those starting lines closer together.
What tools help you measure sales rep productivity?
You measure sales rep productivity with three layers of tooling: a CRM as the system of record, a dashboard on top of it, and clean conversation capture at the front door so the activity data is trustworthy in the first place. The tool you pick matters far less than the quality of what feeds it.
The CRM holds the raw material, every deal, stage, and logged touch. A dashboard turns that into the three-tier view a manager can read in seconds, whether built from native reports or a business intelligence layer. The weak spot is almost always the activity data reps enter by hand, which is exactly where that 28 percent selling week leaks away and where accuracy goes to die. Capturing inbound conversations automatically, so the source, page, and first touch land in the CRM without a rep retyping them, does more for measurement than any chart. Wiring those touches through your integrations and into the CRM means the productivity numbers describe what really happened rather than what someone remembered to log.
How do you improve sales rep productivity?
You improve sales rep productivity by attacking the biggest input first, wasted time, then sharpening conversion through coaching and faster follow-up, rather than pushing everyone to simply do more of everything. Because reps sell only about a quarter of the week, the fastest gains come from clawing back hours, not from stacking on more activity.
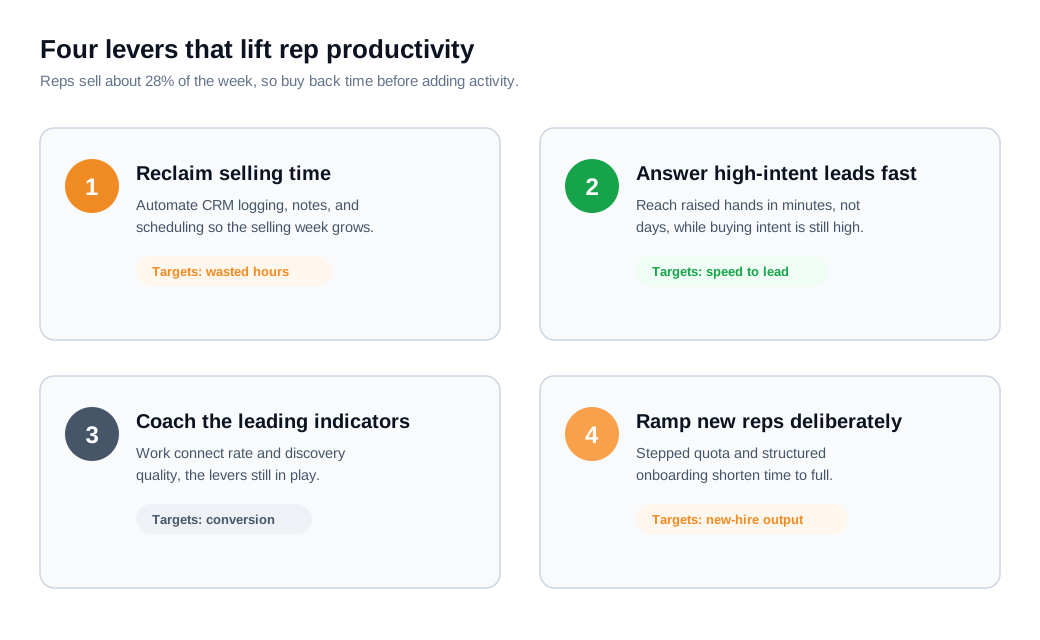
Four levers move the number more reliably than a bigger call target:
- Reclaim selling time. Automate CRM logging, note capture, and scheduling so the 28 percent selling week grows. Handing a rep back even three hours a week is a double-digit percentage lift in their most valuable input, before they change a single behavior.
- Answer high-intent buyers fast. Speed to lead is the rare lever that adds pipeline and lifts win rate at once. The classic Harvard Business Review study The Short Life of Online Sales Leads found that firms contacting a web lead within an hour were far likelier to qualify it, up to 60 times likelier, than those who waited a full day.
- Coach the leading indicators. Review connect rates, discovery quality, and stage conversion, because those are the levers a rep can still change this week. The scoreboard metrics are lagging and already closed.
- Ramp new reps deliberately. Structured onboarding and a stepped quota get sellers to full productivity faster, which lifts blended team output more than holding a green rep to a veteran's number.
The speed lever is the one most teams leave on the table. A high-intent visitor reaching out on your site carries more buying intent than any list you will dial, and every minute of delay drains it. Letting that visitor start talking on the page through live chat that can escalate to a live call, backed by routing and instant notifications that put the lead in front of an available rep, converts more of the same traffic without adding a single dial. That is productivity in its purest form, more output from the input you already have.
Key takeaways
- Productivity is a ratio, not a tally, so measure output like closed revenue and qualified pipeline against the scarce input of selling time, and remember reps spend only about 28 percent of the week actually selling.
- Track three tiers together, leading activity metrics, mid-funnel pipeline metrics, and lagging outcome metrics, because any one of them alone gives a partial and often flattering read.
- Judge activity by yield, not volume, since 90 dials at a 4 percent connect rate lose to 45 dials at 12 percent, and paying on raw activity teaches reps to game the count.
- Normalize before you rank, adjusting for ramp stage (three to nine months to full speed) and territory quality, or a raw leaderboard punishes the new hire and rewards the lucky patch.
- Buy back time before adding activity, because reclaiming a few selling hours a week and answering high-intent leads in minutes lifts output more than a higher call quota.
- Read the distribution, not the average, since a healthy team mean can hide a rep in trouble, and the tail is where coaching and turnover risk actually sit.
TAGS

Written by
Daniel SemeckyCo-founder & CEO
Daniel is the co-founder and CEO of Glimpze. He spends his days talking to revenue teams about how to catch high-intent visitors before they bounce, and writes about inbound sales, lead conversion, and building a motion where marketing and sales actually share a number.


