On this page
Most teams can quote two numbers with confidence: how many people visited the site last month and how many deals closed. Ask what happened to the tens of thousands of visitors who did neither, and the answers turn vague.
That gap is the reason to run a lead generation funnel. It breaks the path from stranger to customer into stages you can count, so a loss that used to hide inside one blurry "conversion rate" shows up as a specific leak at a specific step.
Once you can see the leak, you can fix the right thing instead of guessing at the whole machine.
This guide defines the funnel, walks through each stage, lists the metric that matters at every step, shows how to find the stage quietly costing you customers, and covers the fixes that actually move conversion.
What is a lead generation funnel?
A lead generation funnel is a model of the path a stranger takes to become a customer, split into countable stages so you can see how many people move from one step to the next and where they fall away. The shape carries the meaning: many people enter at the top, far fewer reach the bottom, and the narrowing between stages is where the work lives.
It is a measurement tool first and a diagram second. Sketching the stages on a whiteboard costs nothing. The value comes from instrumenting each stage so you know how many people sit at every level and the rate at which they pass to the next.
A marketing funnel and a sales funnel are two views of the same journey, with marketing usually owning the top and sales owning the bottom. A lead generation funnel spans both, because a lead is the exact handoff point where an anonymous visitor becomes a named contact your team can work.
The funnel is a simplification, and worth treating as one. Real buyers loop back, skip stages, go quiet for months, and return with a shortlist already built.
The point of the model is not to describe every path perfectly but to give you a shared frame and a set of counts, so a marketer and a rep can look at the same report and agree on where the pipeline is thinning. Used that way, the funnel is less a story about the customer and more a diagnostic for your own process.
What are the stages of a lead generation funnel?
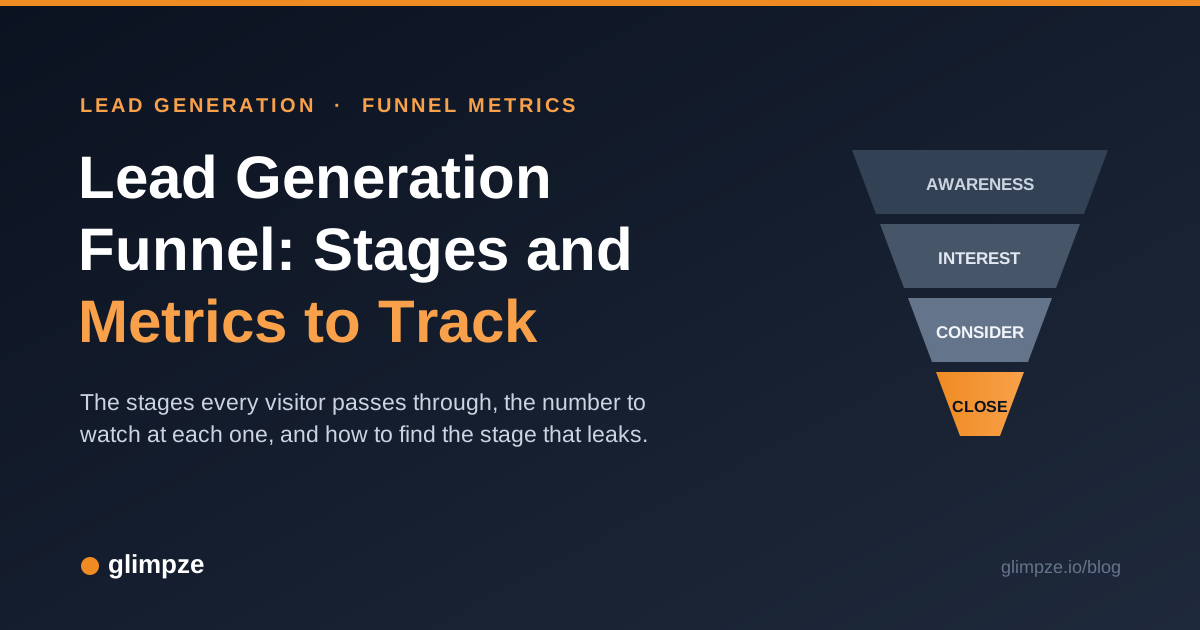
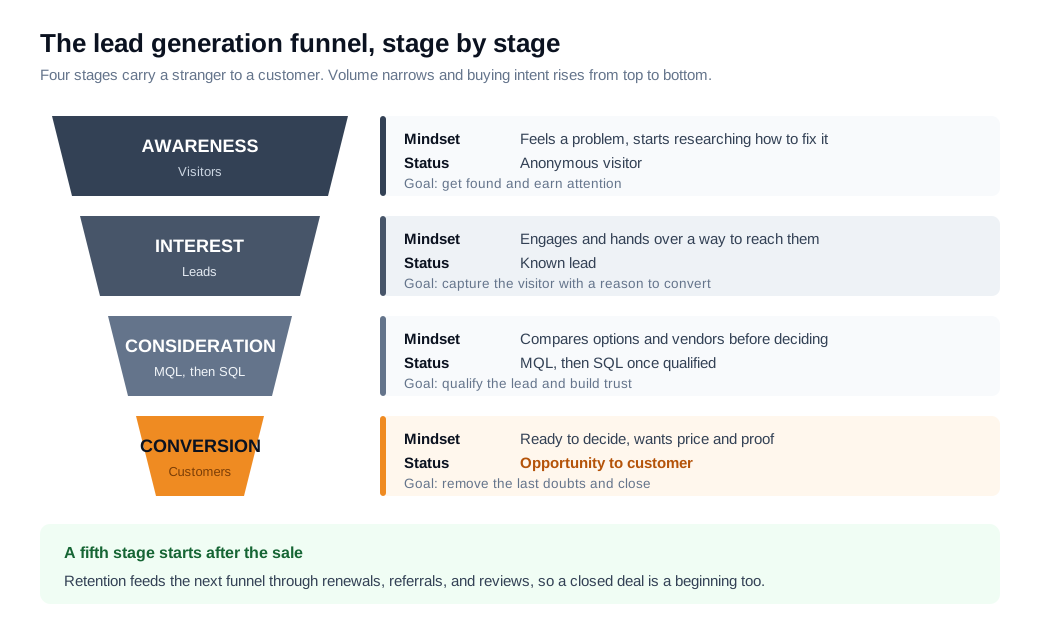
Most lead generation funnels have four core stages: awareness, interest, consideration, and conversion, with a fifth, retention, that begins after the sale. Teams rename them constantly, but the jobs stay consistent, and each stage maps to a shift in how ready the person is to buy.
- Awareness is the top, where someone first recognizes a problem and starts looking for ways to understand it. They arrive as an anonymous visitor from search, social, an ad, or a referral.
- Interest is where that visitor engages and hands over a way to reach them, through a form fill, a chat, or a newsletter signup, turning a visitor into a known lead.
- Consideration is the middle, where the lead compares options and vendors. This is where a marketing-qualified lead (MQL) becomes a sales-qualified lead (SQL), once someone confirms the fit is real and the interest is genuine.
- Conversion is the bottom, where a qualified lead becomes an opportunity and then a customer.
These stages line up with the shorthand many teams use, TOFU, MOFU, and BOFU for top, middle, and bottom of funnel. They also line up with the lead-status labels sitting in your CRM.
The stage names describe the buyer's mindset, and the lead statuses (visitor, lead, MQL, SQL, customer) describe where that person sits in your pipeline. Tracking both is what lets you tie a soft idea like "consideration" to a hard number you can pull from a report.
What metrics matter at each funnel stage?
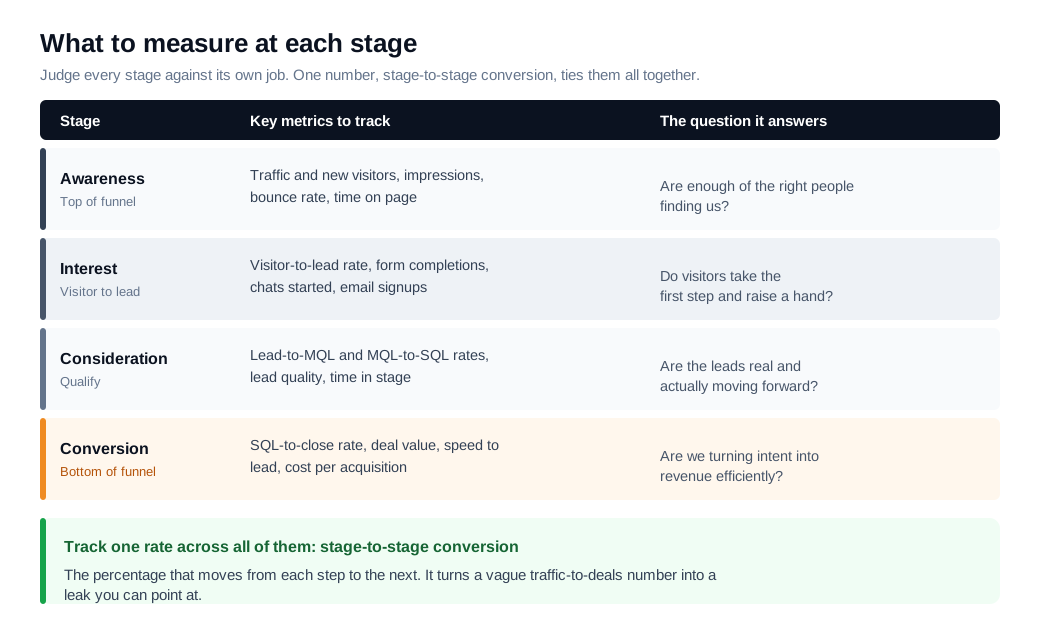
Measure each stage against the job it is supposed to do: reach at awareness, capture at interest, qualification at consideration, and efficient conversion at the bottom. Borrow a metric from the wrong stage, such as holding an awareness campaign to a demo-request target, and good work will read as failure.
- Awareness metrics are leading indicators of supply: traffic, new visitors, impressions, and the quality signals beside them, such as bounce rate and time on page. They tell you whether enough of the right people are finding you.
- Interest turns on the visitor-to-lead conversion rate, along with form completions, chat conversations started, and email signups. This is the first real yes, and small changes here ripple through every stage below.
- Consideration shifts to quality and movement: lead-to-MQL rate, MQL-to-SQL rate, lead score distribution, and time in stage. A lead that sits untouched for weeks is a warning sign by itself.
- Conversion turns money-adjacent and lagging: SQL-to-close rate, opportunity value, cost per acquisition, and speed to lead, the time between a lead raising a hand and a rep reaching them.
One metric ties the whole funnel together, and it is the stage-to-stage conversion rate, the percentage of people who move from each step to the next. That single number turns a fuzzy "traffic to deals" ratio into a map of where you are losing people.
What is a good conversion rate at each stage?
Benchmarks swing hard by industry and channel. As a rough anchor, a typical website turns a low single-digit percentage of visitors into leads and only a fraction of a percent into customers.
Ruler Analytics, drawing on more than five million tracked conversions, puts the median B2B website conversion rate near 2.9 percent, and its channel data shows direct traffic converting around 3.3 percent while paid social sits under 1 percent, per its conversion rate benchmarks. A single company-wide conversion rate hides more than it shows.
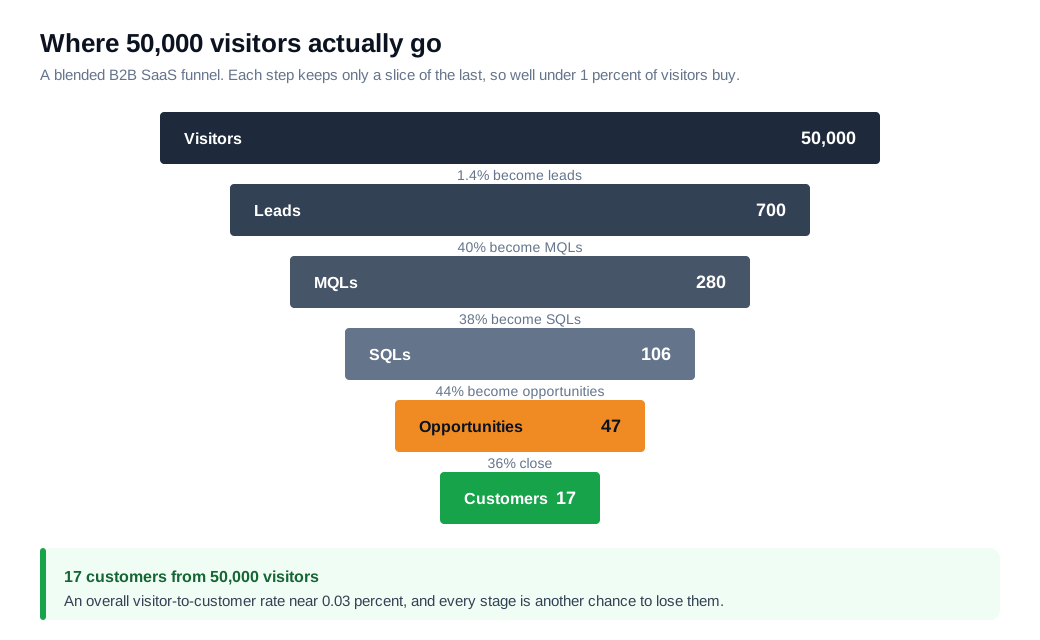
The full funnel makes the compounding clear. First Page Sage's blended B2B SaaS benchmarks put visitor-to-lead near 1.4 percent, lead-to-MQL near 40 percent, MQL-to-SQL near 38 percent, SQL-to-opportunity near 44 percent, and opportunity-to-close near 36 percent, in its B2B SaaS funnel conversion benchmarks. Stack those rates together and the bottom of the funnel is a narrow opening.
Here is the math on one month. Say 50,000 people visit your site:
- At a 1.4 percent visitor-to-lead rate you capture 700 leads.
- Forty percent become MQLs, so 280.
- Thirty-eight percent of those become SQLs, so about 106.
- Forty-four percent turn into opportunities, so roughly 47.
- And 36 percent of those close, so about 17 customers.
Seventeen paying customers out of 50,000 visitors is a visitor-to-customer rate near 0.03 percent. That figure is normal for a funnel like this, and it is exactly why finding the weakest stage matters so much.
How do you find funnel bottlenecks?
Find the bottleneck by calculating the conversion rate between each pair of stages, then comparing each rate to your own history and to industry benchmarks. The stage that falls furthest short of where it should be is the one costing you the most.
Stage-to-stage conversion rate is the single most useful number here, because a raw count of drop-offs will always point at the top of the funnel, where the headcounts are largest.
Work in relative terms, not absolute ones. In the example above, the biggest headcount drop is from 50,000 visitors to 700 leads, yet that 1.4 percent rate may be perfectly ordinary for the industry.
The stage worth investigating is the one furthest below its benchmark. If your MQL-to-SQL rate runs at 20 percent when comparable teams see closer to 38 percent, that gap is where a fix pays back, even though far fewer people are involved.
Once you have the suspect stage, the diagnosis gets specific:
- A weak visitor-to-lead rate points at the page and the offer: form length, the clarity of the value, the friction of the ask.
- A weak MQL-to-SQL rate points at lead quality or the handoff between marketing and sales.
- A weak SQL-to-close rate points at the sales conversation, the pricing, or the timing.
Funnel reports in GA4, Mixpanel, or your CRM can surface the drop-offs, and the stage-to-stage view tells you which one to open first.
Two habits keep this honest. First, segment before you conclude, because a healthy blended rate can hide a broken one. A visitor-to-lead rate of 1.4 percent overall might be 3 percent from organic search and 0.4 percent from a paid campaign, and only the second is the problem.
Second, watch time in stage alongside conversion rate. Leads that convert eventually but take three weeks to move can be as costly as leads that never move, since intent decays while they wait. A stage can be a bottleneck because it loses people or because it holds them too long, and both show up once you track the count and the clock together.
How do you improve funnel conversion?
Improve funnel conversion by fixing the specific bottleneck stage first, then compounding smaller gains across the rest of the funnel with faster response, less friction, and steady nurturing. Chasing every stage at once spreads effort thin, while a focused fix on the weakest link raises the output of every stage below it.
Speed is the biggest lever near the bottom. A Harvard Business Review audit of thousands of companies found that firms contacting a web lead within an hour were nearly seven times more likely to qualify it than those that waited even 60 minutes longer, and many companies took far longer or never replied at all, per The Short Life of Online Sales Leads.
The fix is part process and part presence, since reaching a high-intent visitor while they are still on the page beats any callback queue. Offering a real conversation in the moment, through something like live chat on a pricing or product page, lets you engage the lead at the point intent peaks. Routing that conversation to the right rep instantly, covered in this lead routing guide, keeps the speed advantage from leaking out in the handoff.
Friction is the lever at the interest stage. Every extra form field and unclear step sheds leads, so shortening forms, sharpening the offer, and giving visitors an easier way to raise a hand lift the visitor-to-lead rate directly.
Nurturing is the lever for everyone who is real but not ready yet. Forrester's often-cited figures, compiled by HubSpot, credit strong nurturing programs with generating 50 percent more sales-ready leads at 33 percent lower cost, with nurtured leads tending to make larger purchases, per HubSpot's roundup of nurturing stats.
Teams that treat the website as an inbound sales channel try to shorten the path for the ready minority while nurturing the rest, so the funnel keeps converting instead of leaking at the seams.
The compounding is the payoff. Lift visitor-to-lead from 1.4 to 2 percent and cut your response time at the same time, and you add customers per month without buying a single extra visitor.
Key takeaways
- A lead generation funnel is a measurement tool. Its value comes from instrumenting each stage so you know the count at every level and the rate people pass to the next, which turns a whiteboard sketch into something you can act on.
- The core stages are awareness, interest, consideration, and conversion. They map onto TOFU, MOFU, and BOFU and onto the lead statuses in your CRM: visitor, lead, MQL, SQL, and customer.
- Measure each stage against its own job. Reach and traffic at the top, visitor-to-lead capture in the middle, qualification and lead quality below that, and conversion rate, speed to lead, and cost per acquisition at the bottom.
- Read benchmarks by industry and channel, then do the math. A blended B2B SaaS funnel can turn 50,000 visitors into around 17 customers, a visitor-to-customer rate near 0.03 percent, so small stage gains matter.
- Find bottlenecks with stage-to-stage conversion rate, not raw drop-offs. The stage furthest below its benchmark is the one to fix, even when a bigger crowd leaves higher up.
- Fix the weakest stage first, then compound. Faster response, shorter forms, and steady nurturing lift several stages at once and add revenue without more traffic.
TAGS

Written by
Daniel SemeckyCo-founder & CEO
Daniel is the co-founder and CEO of Glimpze. He spends his days talking to revenue teams about how to catch high-intent visitors before they bounce, and writes about inbound sales, lead conversion, and building a motion where marketing and sales actually share a number.