
On this page
Pipeline looks full. The forecast still misses by 15% for the third quarter running, and the revenue leader wants to know why. The RevOps dashboard answers with two hundred charts, and not one of them says where the money is leaking.
That gap between data and answers is the real RevOps metrics problem. Most teams do not lack numbers. They lack the small set of numbers that explain revenue, and the discipline to watch those while ignoring the rest.
This post covers the metrics RevOps actually owns, the difference between leading and lagging indicators, how to track funnel and pipeline health, where efficiency metrics fit, how to build a dashboard a revenue leader will trust, and how many metrics you should track before the dashboard starts hiding the signal.
What metrics does RevOps own?
RevOps owns the cross-functional metrics that span the handoffs between marketing, sales, and customer success, the numbers no single team can move on its own. Marketing owns lead volume. Sales owns quota. Customer success owns renewals. RevOps owns the seams where those goals meet, and almost every number that predicts revenue lives in a seam.
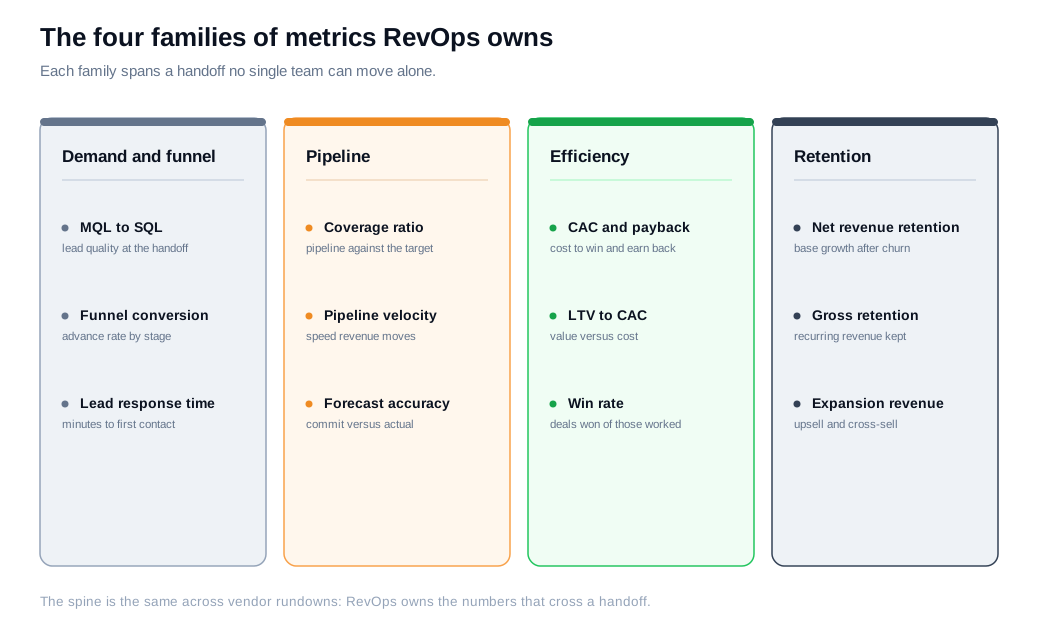
Those metrics sort into four families. Demand and funnel metrics track how leads enter and move: MQL-to-SQL conversion, funnel conversion by stage, and lead response time. Pipeline metrics track the deals in flight: pipeline coverage, pipeline velocity, forecast accuracy, and stage aging. Efficiency metrics price the growth: customer acquisition cost, CAC payback, the ratio of lifetime value to CAC, win rate, and sales cycle length. Retention and expansion metrics track the base after the sale: net revenue retention, gross revenue retention, churn, and expansion revenue.
Vendor rundowns converge on the same core. Highspot's list of revenue operations KPIs, Default's set of RevOps metrics, and Forecastio's catalog all organize the field around funnel conversion, pipeline velocity, forecast accuracy, CAC, and net revenue retention. The labels differ. The spine is the same, because those are the numbers that cross a handoff.
The reason ownership matters is accountability. When forecast accuracy slips, no single team can be blamed or tasked with the fix, because the cause could be marketing's lead quality, sales' stage hygiene, or a definition mismatch between the two. That is exactly the kind of problem RevOps exists to own.
What is the difference between leading and lagging RevOps metrics?
Leading metrics predict revenue before it lands, and lagging metrics report revenue after it already has. Closed revenue, net revenue retention, and win rate are lagging: they tell you what happened. Pipeline created, stage conversion, lead response time, and pipeline velocity are leading: they tell you what is about to happen. A dashboard built only on lagging numbers is a rear-view mirror, useful for the record and no help for steering.
The practical rule is to weight leading indicators for the weekly operating view and lagging indicators for the board view. A revenue leader running the quarter needs to see pipeline coverage and stage conversion move on Monday, weeks before those movements show up in closed revenue. The board, meeting quarterly, wants the lagging outcomes plus the one or two leading signals that explain where the next quarter is heading.
Cadence follows from that split. Leading indicators reward a weekly or biweekly look, because they change fast and give you time to act. Diagnostic metrics like CAC by channel deserve a monthly review. Lagging outcomes settle on a quarterly rhythm. Match the review frequency to how fast the metric can actually move, or you will either chase noise or miss the window to fix a real problem.
How do you track funnel and pipeline health?
Track funnel and pipeline health by measuring stage-by-stage conversion, pipeline coverage against the target, and pipeline velocity together, so a pipeline that looks full but is not converting shows up before the quarter closes. Any one of those numbers can mislead on its own. Coverage of 4x looks safe until stage conversion reveals that most of that pipeline is stuck two stages back.
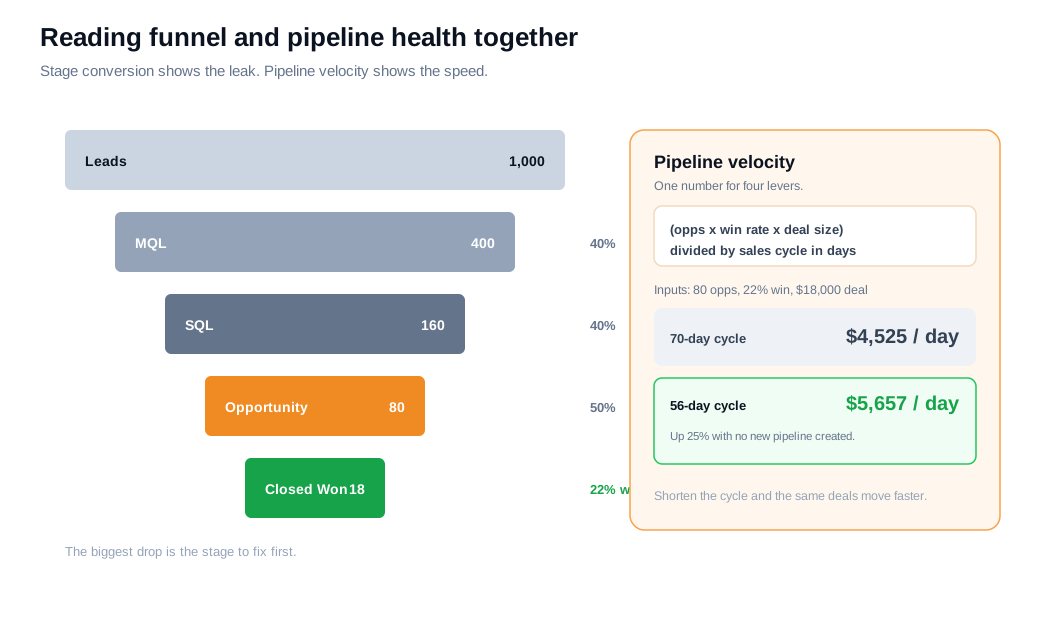
Start with conversion by stage. Measure the share of leads and opportunities that advance from each stage to the next, and the funnel's leak points appear immediately. If MQL-to-SQL runs at 40% but SQL-to-opportunity drops to 12%, the problem is qualification or handoff, and buying more leads to pour in the top will not fix it. Fixing the stage that leaks most is almost always cheaper than adding volume above it.
Pipeline coverage is the next check. Coverage is current pipeline value divided by the target for the period, and healthy B2B SaaS coverage runs 3x to 5x depending on win rate. Below 3x is an early warning that the quarter is at risk while there is still time to build. Forecast accuracy sits alongside it, calculated as actual revenue divided by forecasted revenue, with strong teams landing inside 10% of plan and elite teams inside 5%.
Pipeline velocity rolls those levers into one number. It is (number of opportunities times win rate times average deal size) divided by sales cycle length in days.
Here is a worked example. A team has 80 open opportunities, a 22% win rate, an $18,000 average deal, and a 70-day sales cycle. Velocity is (80 times 0.22 times 18,000) divided by 70, which is about $4,525 per day. Cut the cycle to 56 days by fixing a stalled legal-review handoff, and the same inputs produce roughly $5,657 per day, a 25% lift in how fast revenue moves with no new pipeline created.
The top of the funnel has its own health metric that RevOps owns directly: lead response time. Classic Harvard Business Review research, The Short Life of Online Sales Leads, found that firms contacting a web lead within an hour were far more likely to reach and qualify a decision-maker than firms that waited, while companies that let a full day pass were dramatically less likely to qualify the lead at all. The fix is a process change rather than more effort. Automated routing and notifications put a hot lead in front of the right rep in minutes, and a real-time channel like live chat lets a rep start the conversation while intent is still high, which is the point of a fast inbound sales motion.
How do efficiency metrics fit?
Efficiency metrics answer whether the revenue you win is worth what it costs to win it, the question funnel and pipeline numbers cannot answer on their own. A team can grow pipeline velocity and still burn cash if every dollar of new revenue costs more than a dollar to acquire. Efficiency metrics keep the growth honest.
Four numbers carry most of the signal. Customer acquisition cost is the fully loaded cost to win one customer. CAC payback is how many months of gross margin it takes to earn that cost back, and the median for B2B SaaS sits around 15 months, with SMB recovering in 8 to 12 months and enterprise closer to 18 to 24, so anything under 12 months is generally healthy. The ratio of lifetime value to CAC tells you whether a customer is worth more than they cost to acquire, with 3:1 as the common rule of thumb. The SaaS magic number measures new ARR produced per dollar of sales and marketing spend, where a result above 1 signals efficient growth.
Here is a worked example. You spend $600,000 in a quarter on sales and marketing and add 40 new customers at a $15,000 average contract. CAC is $15,000. If gross margin is 80% and the customer pays $1,250 a month, monthly gross margin is $1,000, so CAC payback is 15 months. Trim CAC to $12,000 by raising the win rate two points and shortening the cycle, and payback falls to 12 months, which moves the business from average to healthy without touching the price.
At the portfolio level, the Rule of 40 checks the growth-versus-profit trade: revenue growth rate plus profit margin should clear 40%. It is a one-line sanity check a revenue leader can run in a meeting, and the median company lands below it, so clearing 40 is a genuine signal of a balanced engine.
How do you build a RevOps dashboard?
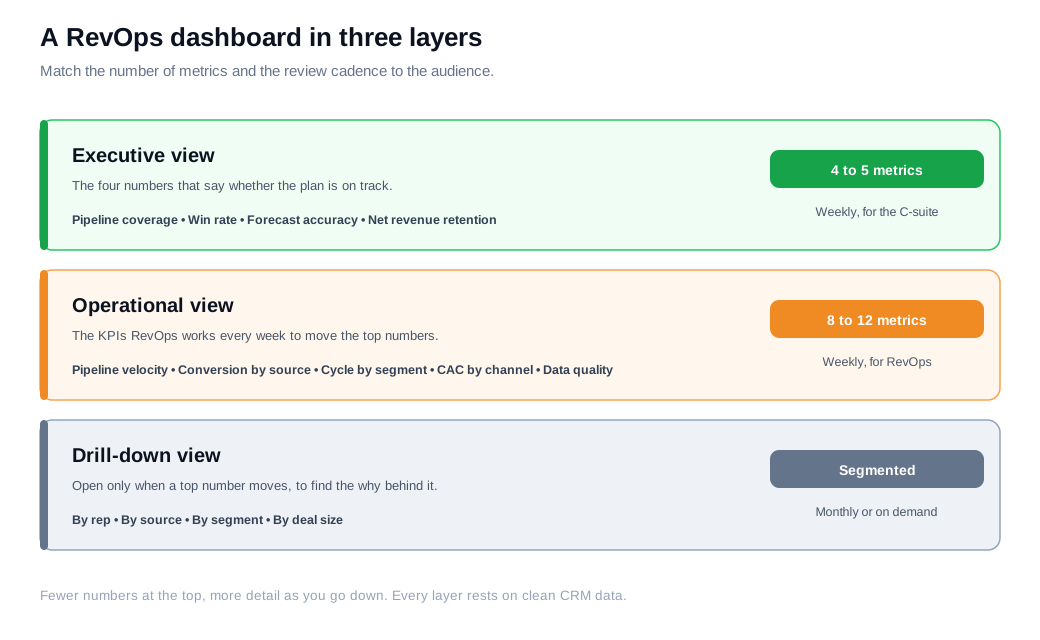
Build a RevOps dashboard in layers: an executive view of four or five numbers, an operational view of eight to twelve, and a drill-down view for diagnosis, rather than one screen that tries to show everything. The layered design is what separates a dashboard people act on from a wall of charts people scroll past.
The executive layer holds the four numbers that tell a revenue leader whether the engine is healthy: pipeline coverage, win rate, forecast accuracy, and net revenue retention, where the 2025 B2B SaaS median lands near 106% and anything above 110% is healthy territory. Checked weekly, those four answer the only question the C-suite is really asking, which is whether the plan is on track. The operational layer sits underneath with the eight to twelve KPIs RevOps reviews weekly, including pipeline velocity, funnel conversion by source, sales cycle by segment, CAC by channel, and a data-quality score. The drill-down layer is where you go when a top number moves, segmented by rep, source, segment, and deal size, so you can find the why behind the what.
Two design rules keep the dashboard useful. Balance leading and lagging indicators so the view predicts as well as records, and weight the leading ones for the weekly operating cadence. And treat data quality as the foundation, because every metric above it inherits its reliability from the CRM underneath. If marketing and sales count a qualified lead by different rules, the conversion number is fiction no matter how clean the chart looks.
The last rule is discipline about what earns a place. A tile that no one will act on is clutter, and clutter buries the numbers that matter. The strongest dashboards show fewer numbers with a trend line next to each, so a reader can see direction at a glance and knows which one to open when the trend bends.
How many RevOps metrics should you actually track?
Track the two or three metrics that explain your biggest revenue problem this quarter at the top of the dashboard, and relegate the rest to a layer you only open when one of the top numbers moves. Both Highspot and Default make the same warning in their KPI rundowns: do not track everything at once, because a dashboard that reports forty numbers tells a leader nothing about which one to act on.
The failure mode is the vanity metric. Tickets closed, tools deployed, and emails sent feel like progress and predict no revenue, so they crowd the screen while the numbers that matter get lost. The test for every metric is simple. If it moved, would anyone do something differently? When the answer is no, the metric belongs in an archive, not on the dashboard.
Scope the count to the audience. A revenue leader's weekly view holds four or five numbers. The RevOps operating review holds eight to twelve. A board deck holds five to seven that connect leading inputs to lagging outcomes. Past those bounds, each added metric costs more attention than it returns, and the dashboard starts to hide the signal it was built to surface.
Key takeaways
- RevOps owns the metrics that span handoffs. Funnel conversion, pipeline velocity, forecast accuracy, CAC, and net revenue retention prove the function precisely because no single team can move them alone.
- Separate leading from lagging. Leading metrics like pipeline created and lead response time predict the quarter, while lagging metrics like closed revenue and NRR record it, so the weekly view should weight the leading ones.
- Read funnel and pipeline health together. Stage conversion, coverage of 3x to 5x, and pipeline velocity each mislead alone, so track them as a set to catch a full pipeline that is not converting.
- Let efficiency metrics price the growth. CAC payback under 12 months, an LTV to CAC ratio near 3:1, and a magic number above 1 tell you whether the revenue you win is worth what it costs.
- Build the dashboard in layers. Four or five numbers for the executive view, eight to twelve for the operating view, and a drill-down for diagnosis, all resting on clean CRM data.
- Track fewer metrics on purpose. Keep the two or three that explain this quarter's biggest problem at the top, and drop any number no one would act on.

Written by
Daniel SemeckyCo-founder & CEO
Daniel is the co-founder and CEO of Glimpze. He spends his days talking to revenue teams about how to catch high-intent visitors before they bounce, and writes about inbound sales, lead conversion, and building a motion where marketing and sales actually share a number.


