
On this page
- What metrics matter in video selling?
- What is the difference between play rate, view rate, and engagement rate?
- How do you measure view and engagement rates?
- What is a good video engagement benchmark?
- How do you tie video to pipeline?
- How do you report on video ROI?
- Which video selling metrics are vanity metrics?
- Key takeaways
- Sources
A rep sends fifty recorded demos in a week and reports "300 views" on the Monday call. The number sounds like progress, and everyone nods. It says nothing about whether a single one of those views turned into a reply, a meeting, or a dollar of pipeline.
Video selling produces a flood of numbers, and most of them are easy to collect and easy to misread. The teams that get real value from video track a short list that ladders from a play all the way to a closed deal, and they drop the ones that only look busy.
This post covers which video selling metrics matter, the difference between play rate and engagement rate, how to measure view and engagement rates against real benchmarks, how to tie video to pipeline, how to report ROI, and which numbers are vanity.
What metrics matter in video selling?
The video selling metrics that matter fall into four tiers that ladder from attention to revenue: reach, engagement, conversion, and pipeline. Each tier answers a different question, and the value of a number rises as you move down the ladder toward money.
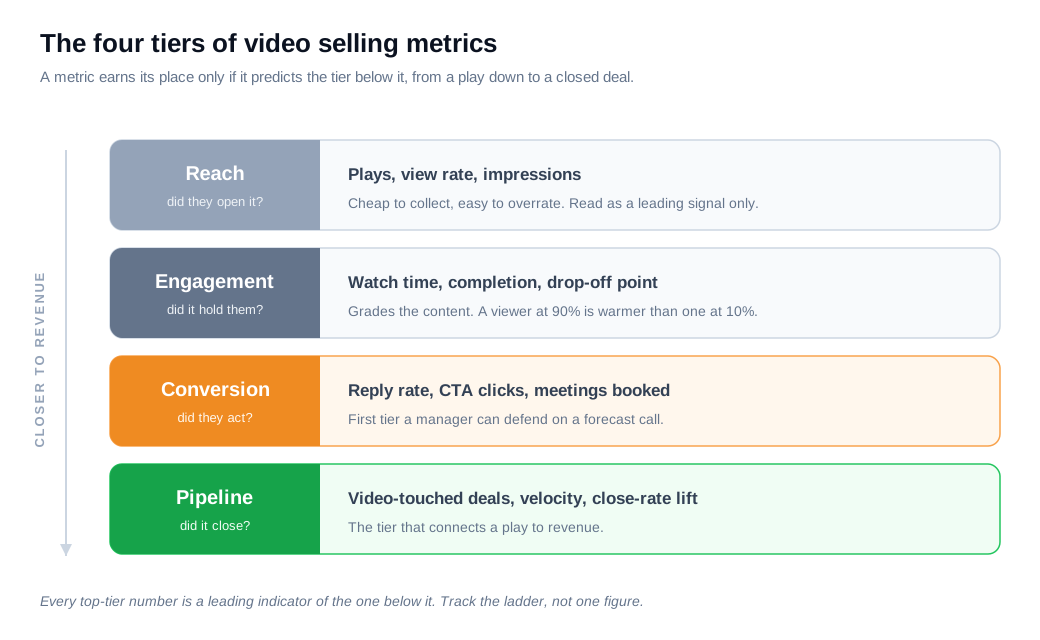
Reach sits at the top and answers "did anyone open it." Plays, view rate, and impressions live here. These are the easiest to collect and the easiest to overrate, because a play costs the buyer almost nothing.
Engagement is the next tier and answers "did it hold them." Average watch time, completion rate, and the drop-off point tell you whether the content earned the attention the play started. A viewer who reaches 90% of a demo is a warmer lead than one who bailed at 10%, even though both count as a single play.
Conversion answers "did they act." Reply rate, click-through on the video's call to action, and meetings booked sit here. This is the first tier a manager can defend on a forecast call, because an action ties a watch to intent.
Pipeline, at the bottom, answers "did it move a deal." Video-touched opportunities, influenced pipeline, deal velocity, and close-rate lift belong here. Gong's analysis of 121,828 web-based sales meetings found deals were 127% more likely to close when video ran across the process, which is the kind of claim this bottom tier exists to test against your own numbers.
Most dashboards over-index on the top tier because those metrics update in real time and look like momentum. The discipline is to read every top-tier number as a leading indicator of a bottom-tier one, and to ask of anything you report: does this predict a reply, a meeting, or a closed deal? If it does not, it is decoration.
What is the difference between play rate, view rate, and engagement rate?
Play rate, view rate, and engagement rate measure three different moments in a single watch, and confusing them is the most common reporting error in video selling.
Play rate is the share of people who saw the video and pressed play. Wistia defines it as plays divided by page loads, expressed as a percentage, so a video on a landing page with a 30% play rate means three in ten visitors chose to start it. Play rate grades the thumbnail, the title, and the placement, not the content itself.
View rate is looser and platform-dependent. A "view" is usually counted after a few seconds of playback, and on some platforms an autoplay counts, so view rate can climb without anyone deciding to watch. Read it as a volume number, and always check what your host counts as a view before you quote it.
Engagement rate is the one that grades the content. Wistia calculates it as the average percentage of the video that viewers watched, roughly total time played divided by plays times the length. A three-minute video with a 50% engagement rate means the average viewer watched about ninety seconds. This is the number that tells you whether the message landed.
The three move independently, which is the point. A clip can have a high play rate and a low engagement rate, meaning a great subject line wrapped around a boring video, so you fix the content. The reverse, low play rate and high engagement, means the few who start it stay to the end, so you fix the thumbnail and the placement. A single blended "views" figure hides both diagnoses.
How do you measure view and engagement rates?
Measure view and engagement rates straight from your video host's analytics, which record every play, the watch curve, and the exact second viewers drop off, then read those numbers as a funnel rather than as standalone stats.
Every serious video tool, including Vidyard, Wistia, Loom, and Sendspark, logs this automatically. The play count and play rate give you the top of the funnel. The engagement graph, a line that falls as viewers leave, shows the average watch curve, and the point where it drops sharply is your drop-off. Vidyard's benchmark data notes that engagement peaks in the first 10% of a video and declines from there, so a cliff earlier than that is a signal the opening is not working.
For one-to-one sales video, the per-viewer heatmap beats any average. Wistia's heatmaps show exactly which parts a single prospect watched, rewatched, or skipped, so a rep can see that a buyer replayed the pricing section twice and open the follow-up on that. That is a metric you can act on the same afternoon.
Here is a worked example. A rep sends a 60-second personalized demo to 100 prospects. At a 30% play rate, 30 people start it. Vidyard's benchmark for sub-minute videos puts completion around two-thirds, so roughly 20 of those watch to the end. Video emails reply at about 6% against 1.5% for plain text, per Vidyard's stats, so the send produces around 6 replies where a text-only version would have produced fewer than 2. Two of those replies become booked meetings. Read as a chain (100 sent, 30 played, 20 finished, 6 replied, 2 booked) each metric explains the step below it, and you can see whether the leak is the thumbnail, the content, or the ask.
Segment before you conclude. A 45-second prospecting clip and a 20-minute technical walkthrough should never be judged on the same engagement bar, which is the subject of the next section.
What is a good video engagement benchmark?
A good video engagement benchmark depends almost entirely on length, because completion falls steadily the longer a video runs, so the only fair comparison is against videos of the same duration.
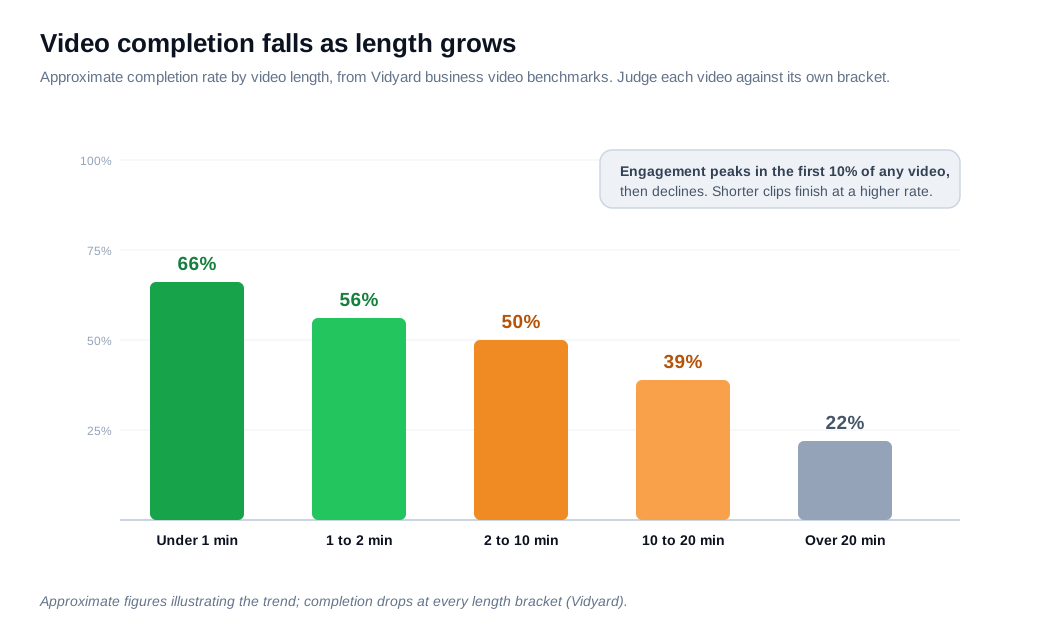
Vidyard's Video in Business Benchmark Report, drawn from more than a million business videos, shows the pattern clearly. About two-thirds of viewers finish a clip under a minute. Roughly half finish a two-to-ten-minute video. Only about a fifth reach the end of anything past twenty minutes. Each length bracket completes at a lower rate than the one before it, without exception.
That decay is why length is a lever, not a detail. A rep who trims a three-minute walkthrough to ninety seconds will usually see completion jump, because the benchmark for the shorter format is simply higher. Vidyard's own guidance is to keep most sales videos under two minutes for that reason.
For play rate, treat 20% to 35% on an embedded page as a reasonable working range and let your own history set the real bar. There is no single "good" number that travels across a cold prospecting clip, a warm follow-up, and an on-site demo, because the audience temperature differs at each.
The practical rule is to benchmark against yourself first and the length bracket second. Pull last quarter's numbers for each video type, set the median as your baseline, and judge every new video against its own category. A 40% completion rate is poor for a 30-second clip and strong for a fifteen-minute deep dive. Without that context, a completion percentage is just a number.
How do you tie video to pipeline?
Tie video to pipeline by pushing video engagement into your CRM at the contact level, so a watched video becomes a timestamped event on an opportunity rather than a stat stranded in a separate dashboard.
The mechanics matter. Most B2B teams need three integrations working together: the video platform feeding view and watch data into the CRM, marketing automation logging content consumption per contact, and an account view that aggregates video watches alongside other touches. Sendspark's guide to video ROI makes the same point, that without those connections the numbers stay stuck at the engagement tier and never reach revenue.
Once the data lands in the CRM, three pipeline metrics become readable. The first is video-touched opportunities: the count and dollar value of open deals where someone watched a video. The second is deal velocity, whether video-touched deals move stage to stage faster than the rest. Vidyard's virtual selling research found more than a third of sales pros say custom-recorded video shortens their deal cycle, a velocity claim you can now check against your own stages. The third is close-rate lift, comparing win rates on video-touched deals against matched deals with no video.
Speed is where this pays off in real time. A buyer who just finished your demo has raised a hand whose value decays by the hour, so a high watch rate should trigger an immediate handoff. Routing that signal straight to an available rep through tight lead routing and notifications turns a watch into a live conversation while the intent is fresh, and offering a live video call on your highest-intent pages closes the gap between the metric and the meeting. Pairing it with live chat gives a hesitant buyer a lower-commitment way to start.
The rule is to make every video engagement visible on the deal it belongs to. A watch that never reaches the CRM cannot be tied to pipeline, no matter how high the completion rate.
How do you report on video ROI?
Report video ROI as influenced pipeline first and incremental impact second, using multi-touch attribution with a lookback window long enough to cover your sales cycle, then state clearly which of the two numbers you are showing.
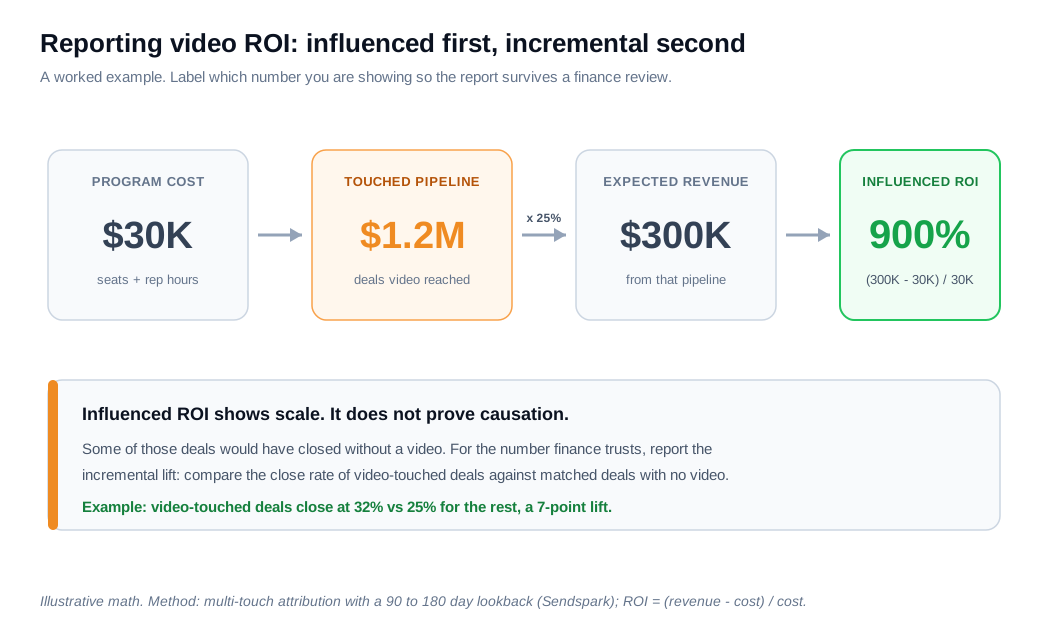
Start with the formula. ROI equals revenue generated minus cost, divided by cost, times 100. The hard part is the revenue term, because a sales video is rarely the only touch on a deal, and multi-touch attribution spreads credit across every interaction so the video gets its share even when it was the third touchpoint rather than the last. Sendspark's guide recommends a 90 to 180 day lookback so video's influence on long B2B cycles is not undercounted.
Here is a worked example. A team spends $30,000 in a year on video seats and the rep hours to record. Over that year, deals that touched a video represent $1.2 million in pipeline. At a 25% historical win rate, that pipeline is expected to produce about $300,000 in revenue. Run the formula, 300,000 minus 30,000 divided by 30,000, and the influenced ROI works out to 900%.
That number is honest only if you label it. Influenced ROI counts every dollar of pipeline video merely touched, which overstates causation, because some of those deals would have closed anyway. The stronger figure is incremental: compare the close rate and cycle length of video-touched deals against matched deals with no video, and report the difference. If video-touched deals close at 32% against 25% for the rest, that 7-point lift is the number a finance team will trust.
Report both, in that order, and name the method. A single unattributed "video drove $300K" invites the obvious question of how you know, while "video influenced $1.2M in pipeline and video-touched deals closed 7 points higher than matched deals" survives scrutiny. Good ROI reporting connects a play at the top of the ladder to a closed deal at the bottom.
Which video selling metrics are vanity metrics?
Vanity metrics in video selling are the ones that rise without predicting a reply, a meeting, or a deal: raw view counts, total plays, likes, and social shares on a sales clip. They feel productive because they only ever go up.
Raw views are the clearest example. A view can be counted at three seconds, so a big number can hide the fact that nobody watched past the intro. The view earns meaning only when you pair it with engagement rate and a downstream action. On its own it is a headline, not a signal.
Total plays across a library has the same problem. A rep can send more videos and watch the play count grow while reply and meeting rates flatline, which mistakes activity for progress. The fix is to report plays next to the conversion they produced, never alone.
None of these are useless, and that is the trap. They are fine as diagnostic context, and misleading as headline results. Keep them in the second column of a report, and put a conversion or pipeline number in the first.
Key takeaways
- Track four tiers, not one number. Reach, engagement, conversion, and pipeline each answer a different question, and a metric earns its place only if it predicts the tier below it.
- Play rate, view rate, and engagement rate are separate measures. Play rate grades the thumbnail, view rate is a volume count, and engagement rate grades the content, so report them apart rather than as one blended "views" figure.
- Judge engagement against length. Vidyard's data shows completion falling from about two-thirds under a minute to roughly a fifth past twenty minutes, so benchmark every video against its own duration and your own history.
- Push video engagement into the CRM. A watch that never reaches the deal record cannot be tied to pipeline, and video-touched opportunities, deal velocity, and close-rate lift are the metrics that connect video to revenue.
- Report influenced ROI and incremental ROI, and label which is which. Influenced pipeline shows scale, while the close-rate difference between video-touched and matched deals is the number finance will trust.
- Act on the metric the same day. A high watch rate is a raised hand whose value decays by the hour, so route it to a live rep fast rather than letting it sit in a dashboard.
TAGS

Written by
Daniel SemeckyCo-founder & CEO
Daniel is the co-founder and CEO of Glimpze. He spends his days talking to revenue teams about how to catch high-intent visitors before they bounce, and writes about inbound sales, lead conversion, and building a motion where marketing and sales actually share a number.


