
On this page
- What is a CRO audit?
- When should you run a CRO audit?
- What does a CRO audit checklist include?
- What data should you gather first?
- How do you read a page for conversion friction?
- How do you turn audit findings into experiments?
- How do you prioritize which experiments to run first?
- Conversion rate optimization audit FAQs
- Key takeaways
- Sources
A team ships a redesign, books a meeting, argues about button colors for an hour, and launches five tests. Four of them go nowhere. That is the normal outcome, not a run of bad luck. Across 28,304 experiments that CXL analyzed, only about 20 percent even reached statistical significance, and among the ones that did, roughly 1 in 7.5 moved conversion by more than 10 percent.
The teams that beat those odds tend to do one thing before they touch a test. They audit. They find where visitors actually drop off, gather evidence about why, and only then decide what to change, so each experiment starts from a documented problem rather than a hallway opinion.
This post covers what a CRO audit is, when to run one, what a checklist covers, the data to gather first, how to read a page for friction, how to turn findings into experiments, and how to decide which of those experiments to run first.
What is a CRO audit?
A CRO audit is a structured review of a website or funnel that finds where visitors fail to convert and gathers evidence about why, so you can prioritize the changes most likely to lift conversion. The output is a diagnosis and a ranked list of hypotheses, and the fixes come afterward.
Think of it as a 360-degree look at the user experience that tests how each page performs and surfaces the factors dragging the conversion rate down, which is how Unbounce frames it. A good audit blends two kinds of evidence. Quantitative data from analytics and funnel reports shows you the steps where people leave. Qualitative data from heatmaps, session recordings, and surveys shows you what they were struggling with when they left.
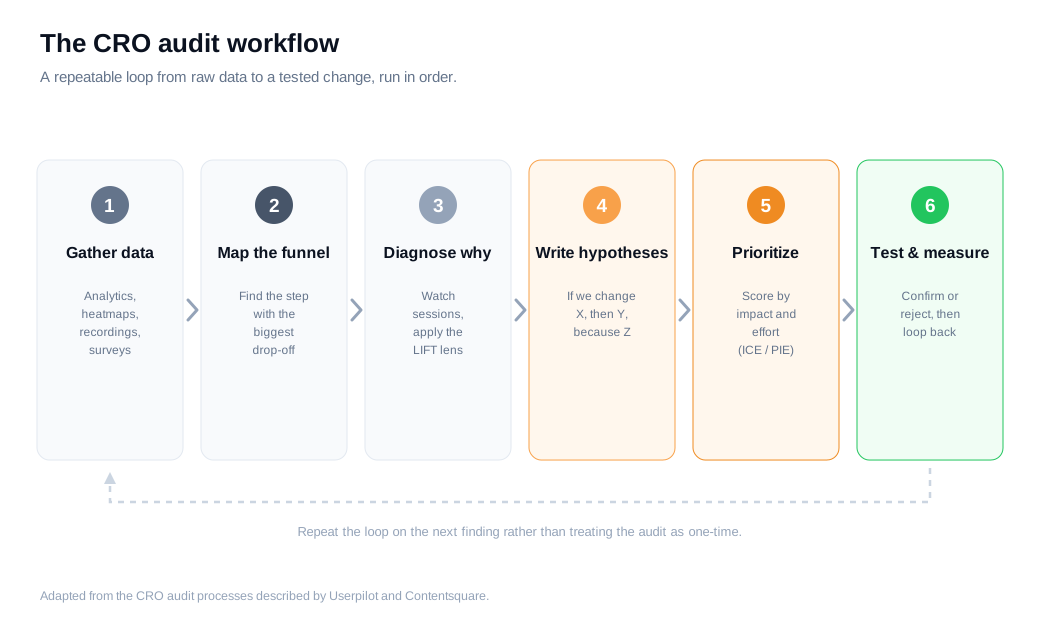
The distinction that matters is between an audit and a redesign. A redesign changes things and hopes. An audit produces a testable claim about a specific problem, backed by data, that a later experiment can confirm or reject. Skip the audit and you test whatever the loudest person in the room believes, the pattern that yields four dead tests out of five.
When should you run a CRO audit?
Run a CRO audit before you scale paid traffic, after a redesign or migration, when conversion drops without an obvious cause, when traffic grows but revenue or lead quality does not, and on a regular cadence for your highest-value pages. Each of these moments is a point where money is either about to be wasted or already leaking.
Scaling ad spend on a page that converts poorly is the most expensive mistake of the group. If your pricing page turns 3 percent of visitors into signups, doubling paid traffic doubles your cost while the same 97 percent slip away. An audit first, more budget second, is the cheaper order of operations.
The other triggers follow the same logic. A redesign can quietly break a form field or a tracking tag, so you verify before you celebrate. A sudden conversion drop needs a diagnosis, not a guess. And even when nothing looks wrong, running an audit once or twice a year on the pages that carry the most revenue keeps small regressions from compounding. Landingi's CRO audit checklist treats these recurring reviews of key pages as routine maintenance rather than a one-time project.
What does a CRO audit checklist include?
A CRO audit checklist covers the areas that decide whether a visitor converts: analytics and tracking, the value proposition and messaging, calls to action, forms, page speed, mobile experience, navigation, and trust signals. Each is a place where friction hides and maps to a fix you can ship.
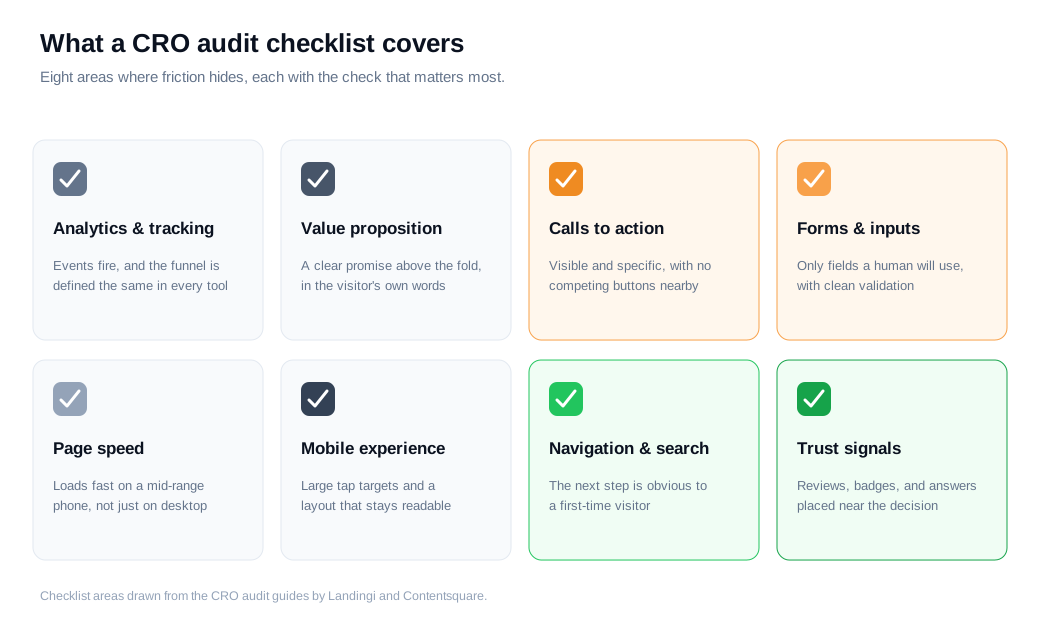
Analytics and tracking come first, because a broken funnel report or a mis-fired conversion event makes every later step unreliable. Confirm that the events you care about fire correctly and that your funnel is defined the same way in every tool.
The rest of the list moves from message to mechanics. Does the value proposition state a clear promise above the fold, in the visitor's own words? Are the primary calls to action visible, specific, and free of competing buttons? Do the forms ask only for what a human will actually use, and validate cleanly? Does the page load fast on a mid-range phone, and does the mobile layout keep tap targets large and content readable? Is the navigation obvious enough that a first-time visitor can find the next step? And are there trust signals, meaning reviews, security badges, and plain answers to the questions that make people hesitate, near the point of decision? Contentsquare's audit guide walks the same journey from traffic through to checkout, checking each stage for the leak.
What data should you gather first?
Gather quantitative data first to find where visitors drop off, then qualitative data to understand why, because the numbers point to the broken step and the behavior explains the cause. As FullSession puts it, quantitative data tells you where it is broken and qualitative data tells you why, and combining the two is what moves you from guessing to informed decisions.
Start with a funnel report. In GA4, the Funnel Exploration report lets you lay out your conversion path step by step and read the exit rate at each one. Here is a worked example. Say 12,000 people view your pricing page in a month. Of those, 3,600 click a plan (30 percent), 1,080 start signup (30 percent of the clickers), and 540 finish (50 percent of the starters), for an overall pricing-to-signup rate of 4.5 percent. The steepest proportional drop sits at the very first step, where 70 percent view a plan and never click one. That is where the audit should look next.
Then switch to qualitative evidence to explain the drop. Pull 20 to 50 session recordings of visitors who viewed pricing and left without clicking a plan, and layer a heatmap over the page. Microsoft Clarity offers both recordings and heatmaps at no cost, so budget is rarely the blocker. Surveys and support conversations add a third layer, and reading your live chat transcripts is one of the fastest ways to hear the exact objection in a customer's own words, since the questions people ask a rep are the same doubts that silently stop others. Userpilot's step-by-step audit process follows this same order: establish the baseline with analytics, then form hypotheses from behavioral data rather than the other way around.
How do you read a page for conversion friction?
Read a page against the six factors in WiderFunnel's LIFT model: value proposition, relevance, clarity, urgency, and the two forces that suppress conversion, anxiety and distraction. The model gives your audit a repeatable lens so two reviewers looking at the same page notice the same problems.
The LIFT model, created by Chris Goward, treats the value proposition as the vehicle for conversion and the other five factors as forces acting on it. Value proposition asks whether the promise is strong and believable. Relevance asks whether the page matches what the visitor expected when they clicked, since an ad about "free CRM" that lands on a generic homepage disorients people. Clarity asks whether the message and the next action are immediately obvious, and Goward's team notes clarity is where most marketers struggle.
The last two factors work in the opposite direction. Anxiety covers the doubts that hold a visitor back, such as unclear pricing, no refund terms, or a form asking for a phone number too early. Distraction covers every extra link, option, and banner that pulls attention away from the one action you want. Walk any high-value page through these six questions and the friction that your funnel data pointed to usually becomes concrete enough to write down.
How do you turn audit findings into experiments?
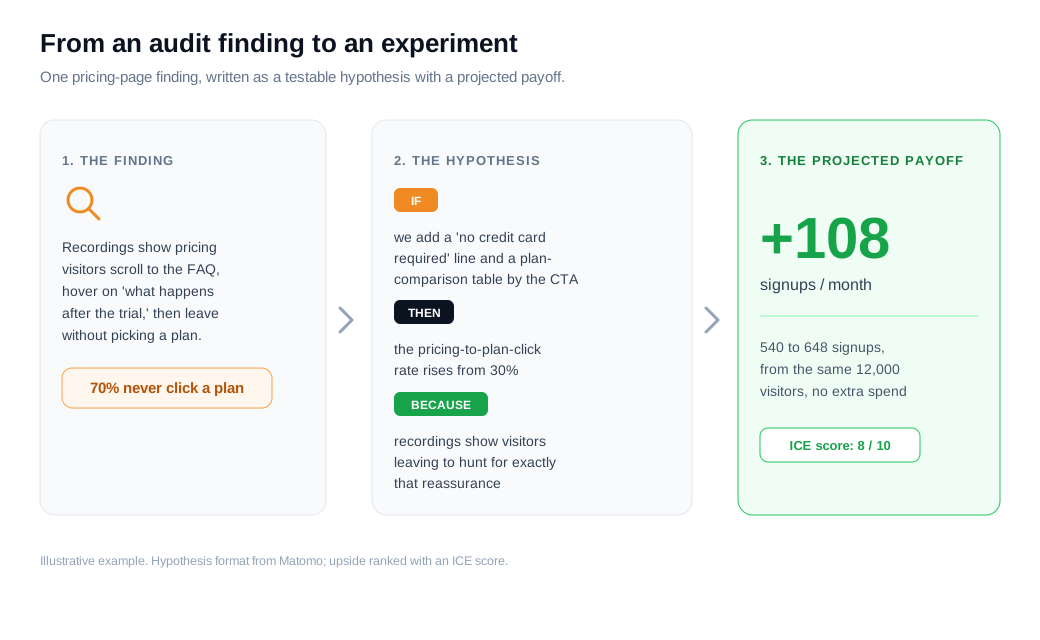
Turn each finding into a testable hypothesis using the format "if we change X, then Y will improve, because Z," where the "because" ties directly to the evidence you gathered. A raw observation is not yet an experiment. A hypothesis names the change, the metric it should move, and the reason drawn from your data, which is what makes the result interpretable either way.
Matomo's guide to CRO testing uses this same if-then-because structure to keep hypotheses specific and grounded rather than vague hunches. Continue the pricing example. Your session recordings show visitors scrolling repeatedly to the FAQ, hovering on "what happens after the trial," then leaving without picking a plan. The finding becomes: if we add a "no credit card required" line and a short plan-comparison table beside the primary call to action, then the pricing-to-plan-click rate will rise from 30 percent, because recordings show visitors leaving to hunt for exactly that reassurance.
Now attach a number so the test has a stake. Lifting plan clicks from 30 to 36 percent on 12,000 visitors, with the downstream steps holding steady, would carry signups from 540 to roughly 648, an extra 108 signups a month from the same traffic. That projection is what tells you whether the engineering time is worth it. For high-intent pages like pricing and demo requests, some of the best findings are not tests at all but changes to how you respond in the moment. A stalled visitor on a pricing page is a live signal, and inbound sales teams often recover more revenue by triggering a proactive outreach nudge or a real conversation than by waiting on a next-quarter test.
How do you prioritize which experiments to run first?
Prioritize experiments with a scoring model such as ICE (Impact, Confidence, Ease) or PIE (Potential, Importance, Ease), so you rank ideas by expected payoff and effort instead of by who argued hardest. You score each hypothesis on its dimensions, average the numbers, and test from the top of the list down.
The two models answer slightly different questions. ICE scoring rates a single hypothesis on the impact you expect, your confidence it will work given the evidence, and the ease of building it. The PIE framework, from the same WiderFunnel lineage as the LIFT model, ranks pages or areas by their potential to improve, their importance to the business, and how easy they are to change. A common pattern is to use PIE to decide which pages deserve attention this quarter, then ICE to order the individual experiments on those pages.
Score the pricing hypothesis above and you might land on Impact 8, Confidence 7, Ease 9, for an average of 8, which pushes it near the top. Two cautions keep the scores honest. First, these models rate upside but not risk, so a high score can still hide a test that burns three weeks of engineering and returns an uninterpretable result. Second, traffic sets a hard limit on what you can learn: significance typically needs somewhere around 250 to 400 conversions per variation, and CXL found only 20 percent of experiments reach the 95 percent mark at all, partly because 47.2 percent of teams admitted they had no fixed rule for when to stop a test. On a low-traffic page, a redesign backed by strong qualitative evidence often beats a formal A/B test that can never gather enough data to conclude.
Conversion rate optimization audit FAQs
How long does a CRO audit take?
A focused audit of a single funnel usually takes one to two weeks, and a full-site audit runs closer to three to four. Most of that time goes into gathering enough session recordings and funnel data to see real patterns, so a high-traffic page audits faster than a quiet one.
What is the difference between a CRO audit and a UX audit?
A UX audit evaluates usability and the overall quality of the experience, while a CRO audit is narrower and tied to a specific conversion goal, judging every finding by whether fixing it should move that metric. The two overlap heavily, since most usability problems also cost conversions, but a CRO audit always ends in ranked, testable hypotheses aimed at a number.
Do you need paid tools to run a CRO audit?
No, you can run a credible audit with free tools. GA4 gives you funnel analysis and Microsoft Clarity gives you heatmaps and session recordings at no cost, which together cover the where and the why. Paid form-analytics and testing platforms make the work faster and add depth, though they are an upgrade rather than a requirement for a first audit.
Key takeaways
- A CRO audit is a diagnosis, not a redesign. It finds where visitors drop off and why, then produces a ranked list of testable hypotheses instead of untested changes.
- Run it before you spend, not after. Auditing before you scale paid traffic, after a redesign, or when conversion slips is far cheaper than buying more traffic for a leaky page.
- Quantitative data finds the leak, qualitative data explains it. Start with a funnel report to locate the drop-off, then use recordings, heatmaps, surveys, and chat transcripts to understand the cause.
- A finding is only useful once it becomes a hypothesis. Write each one as "if we change X, then Y will improve, because Z," and attach a projected impact so you know the effort is worth it.
- Prioritize by payoff and effort, and respect your traffic. Score ideas with ICE or PIE, but remember most tests never reach significance, so low-traffic pages may call for evidence-backed changes over formal experiments.
- Most experiments do not win, so quality of input matters. Only about 20 percent of tests reach significance, which is why auditing first raises the odds that the tests you run start from a real problem.
TAGS

Written by
Nilas MylerCo-founder & CTO, Glimpze
Nilas is the co-founder and CTO of Glimpze, an inbound sales tool that turns high-intent website visitors into live conversations. A former SEO consultant for some of the largest companies in Denmark, he writes about speed-to-lead, inbound sales, and conversion rate optimization — the technical and operational mechanics of turning traffic into pipeline.


