
On this page
A board member asks a founder for the one number that best predicts whether the company will still be growing in three years. Not new bookings, not headcount, not pipeline coverage. Net revenue retention. It is the figure that says what happens to a dollar you have already earned after a full year of upgrades, downgrades, and cancellations.
The trouble starts the moment someone quotes a benchmark without context. "Good NRR is over 100 percent" is true and close to useless, because a 106 percent result that looks healthy for a small-business tool would be a quiet disaster for an enterprise platform. What counts as a good NRR benchmark depends on who you sell to, how you price, and how big you already are.
This post covers how net revenue retention is calculated, what a good number really looks like, how the benchmarks shift by segment, what separates the best-in-class companies, why the metric moves your valuation, how it differs from gross retention, and how to set a target you can actually defend.
What is net revenue retention, and how do you calculate it?
Net revenue retention measures how much recurring revenue you keep and grow from your existing customers over a period, usually twelve months, while ignoring anything you earn from brand-new customers. You take the recurring revenue from a starting group of accounts, add expansion, subtract downgrades and cancellations, and divide by where that group began.
Wall Street Prep states the formula plainly: NRR equals starting recurring revenue plus expansion, minus contraction, minus churn, all divided by the starting recurring revenue, then multiplied by 100. New logos acquired during the period never enter the math. The metric follows one cohort you already had and watches what it does over time.
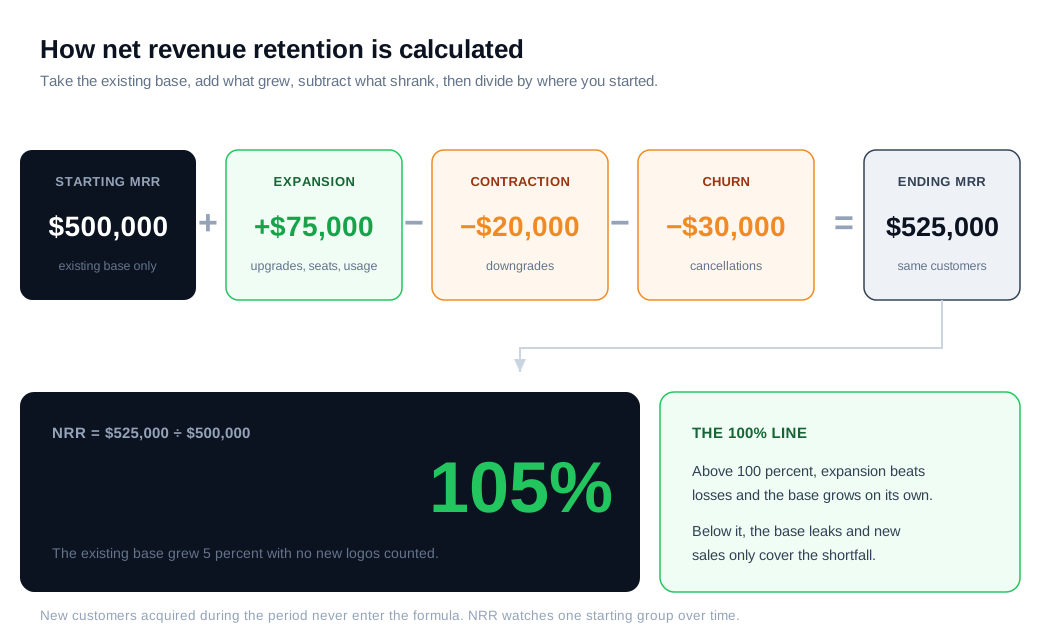
Here is the worked example. You begin the year with $500,000 in monthly recurring revenue from your existing base. Over the next twelve months those same customers upgrade and add seats worth $75,000, some downgrade for a loss of $20,000, and a handful cancel, taking $30,000 with them. Ending revenue from that starting group is $500,000 plus $75,000 minus $20,000 minus $30,000, or $525,000. Divide $525,000 by $500,000 and you land on 105 percent NRR. The base grew 5 percent without a single new customer. ChartMogul makes the same point: any figure above 100 percent means expansion outran your losses, so the book you already own funds growth on its own.
What is a good NRR for SaaS?
A good NRR for SaaS starts at 100 percent, the line between a customer base that grows by itself and one that leaks, and the median private company sits a few points above it. Below 100 percent, you lose revenue from existing customers faster than you expand it, which forces the sales team to run harder every quarter just to stay level.
SaaS Capital put the 2025 median net revenue retention for bootstrapped companies in the $3 million to $20 million ARR range at roughly 103 percent, with the 90th percentile near 118 percent. So the typical private company in that group grows its existing base by a low single-digit percentage each year before adding one new logo, while the strongest performers grow it by close to a fifth.
Public companies run higher because they skew enterprise and often price on usage. FE International notes that best-in-class public SaaS now averages roughly 120 to 125 percent, and its guide treats a median in the low 100s as the private-market norm. A useful mental scale, widely used in venture reporting, reads 100 percent as good, 110 percent as better, and 120 percent and up as best.
That single median is where most people stop, and it is also where they go wrong. A blended number tells you almost nothing until you break it down by the customers underneath it.
How do NRR benchmarks vary by segment?
NRR benchmarks vary widely by segment, and the biggest driver is who you sell to: enterprise-focused companies routinely post medians near 118 percent, mid-market lands around 108 percent, and small-business tools sit near 97 percent, under the break-even line. Those figures come from FE International, and the pattern holds across benchmarking studies.
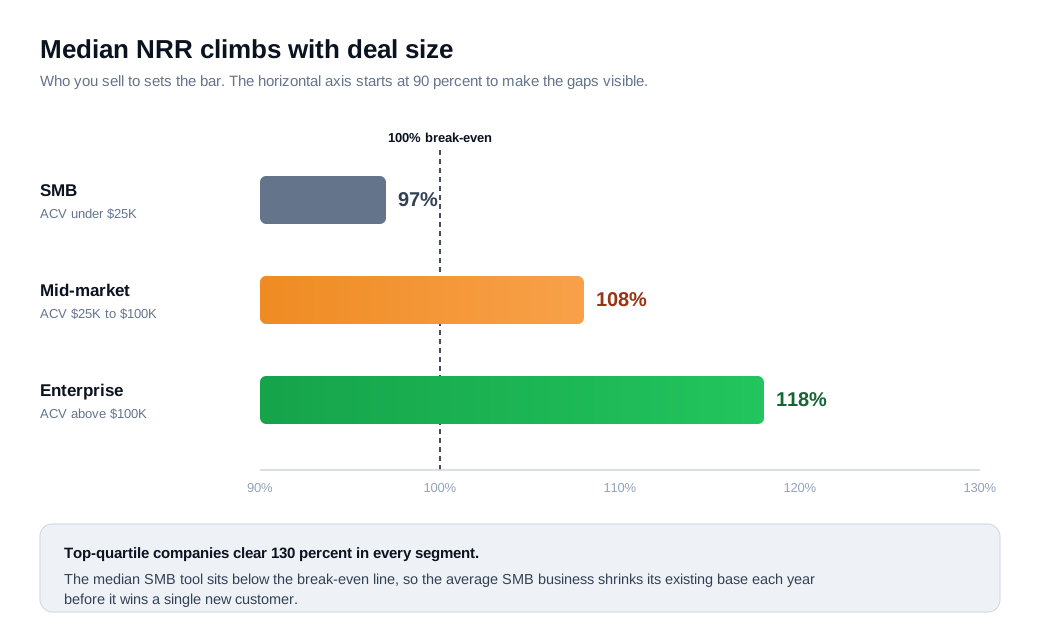
The gap is structural. Enterprise accounts expand through seats, usage tiers, and new modules, and they churn slowly because switching costs are high and a signed multi-year contract holds. Small-business accounts do the opposite: budgets get cut, companies fold, and a monthly plan is easy to cancel, so gross churn alone can pull the segment below 100 percent before any expansion is counted.
Average contract value tracks the same curve. SaaS Capital reports that companies with $25,000 to $50,000 in ACV show a median NRR of 102 percent, a top quartile of 111 percent, and a lower quartile of 97 percent. Move up a tier in deal size and the whole distribution shifts with it.
Pricing model bends the number further. A usage-based product, where spend rises as the customer consumes more, tends to carry higher NRR than a flat monthly subscription, because expansion happens automatically instead of requiring an upsell conversation. Read a benchmark against your own segment, ACV band, and pricing before you judge whether your figure is strong.
One clarification worth keeping straight: NRR deliberately excludes new logos, so a healthy inbound sales engine and a healthy NRR are two separate scoreboards. A company can post strong retention while its new-business funnel stalls, or win logos fast while its base quietly leaks. You need both reading well, and NRR only tells you about the second.
What separates best-in-class NRR?
Best-in-class NRR, meaning a figure that holds consistently above 120 percent, comes from building expansion into the product and the pricing so revenue grows as the customer succeeds, instead of leaning on a once-a-year renewal call to hold the line. The companies at the top of the range almost all share one trait: the more a customer uses the product, the more they pay, without anyone having to negotiate it.
Consumption pricing is the clearest version of this. Snowflake reported net revenue retention of 125 percent as of October 2025, and it bills for compute and storage by usage. As a customer's data footprint grows, spend grows with it, no new contract required. That mechanism turns product adoption directly into expansion revenue, which is why usage-based leaders cluster at the high end of the benchmark.
The second trait is discipline about where the number comes from. CRV warns that an aggregate NRR can hide segment-specific failures: a company might show 130 percent overall while losing 20 percent of its small-business revenue every year, propped up by a few large accounts that keep expanding. The fix is to calculate NRR separately by segment, cohort vintage, and region, so a strong headline cannot mask a leaking corner of the base.
The third is treating expansion as a retention job rather than a sales event. Catching the moment a customer bumps into a usage limit or asks about a feature on a higher tier, and answering it in context through something like in-product live chat, is one of the quieter levers behind a high expansion rate. The upsell lands because you were present when the need appeared, not because a renewal date arrived on the calendar.
Why does NRR move your valuation?
NRR moves your valuation because it is the closest thing SaaS has to proof of durable, compounding growth, and buyers pay a steep premium for that proof. Software Equity Group analyzed public SaaS multiples in the fourth quarter of 2024 and found that companies with net retention above 120 percent traded at a median of 11.7 times trailing revenue, against 6.0 times for those in the 100 to 110 percent band and just 4.1 times for those under 100 percent.
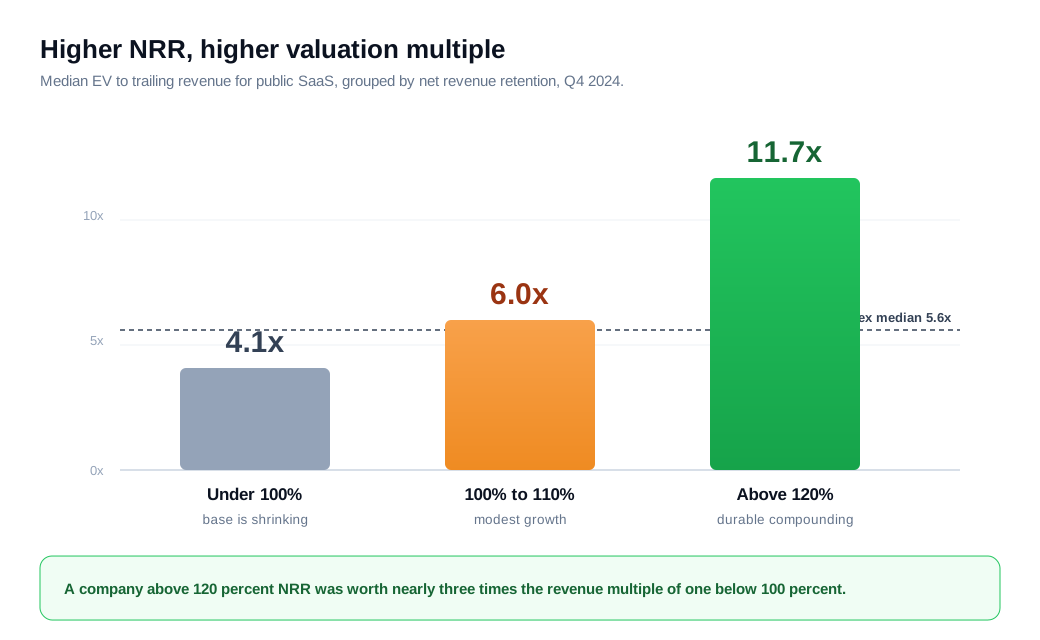
That is close to a threefold spread in the multiple, driven by one retention metric. The logic is simple once you follow the money. A high-NRR business gets most of next year's growth from customers it already has, which is cheaper and far more predictable than buying it through new-customer acquisition, so the market prices that future revenue with more confidence.
The compounding is where the value really sits. Take a $10 million base and hold new sales at zero. At 115 percent NRR it becomes about $20.1 million in five years, a clean double, purely from the existing book. At 100 percent it stays flat at $10 million. At 90 percent it shrinks to roughly $5.9 million. Same starting point, three completely different companies five years out, and the only variable is retention.
How is NRR different from GRR?
NRR and gross revenue retention track the same customer base, but GRR ignores expansion, so it can never top 100 percent and it tells you how leaky the bucket is before any upsell papers over the holes. You calculate it as starting recurring revenue minus contraction and churn, divided by the start, with expansion left out entirely.
Read the two together and you learn something neither shows alone. A company can post 105 percent NRR while its GRR sits at 88 percent, which means 17 points of expansion are masking real churn underneath. SaaS Capital found bootstrapped companies in the $3 million to $20 million range running a median GRR near 91 percent, and most benchmarks treat 90 percent as the healthy floor, with enterprise clearing it comfortably and small-business tools often landing in the low-to-mid 80s.
The practical read is direction. If your NRR is strong but your GRR is weak, your growth is resting on a handful of expanding accounts, and the day one of them leaves, the number drops fast. A healthy pairing looks like 92 percent GRR under 115 percent NRR: you lose a little at the edges, and the customers who stay spend meaningfully more over time.
How do you set your NRR target?
Set your NRR target by starting from your segment's median, adjusting for your pricing model, and checking it against your gross retention floor, rather than copying a public company's headline figure. A flat-rate small-business tool aiming for Snowflake's 125 percent is planning to miss.
Work through it in order. First, anchor to your ACV tier: near 97 percent if you sell to small business, around 108 percent for mid-market, near 118 percent for enterprise. Second, adjust for how you price. Add headroom if your revenue expands with usage, and take some off if you charge a flat monthly rate with few upgrade paths. Third, check your gross retention. If your GRR is below the segment floor, your NRR target is a fantasy until you fix the leak, because expansion cannot durably outrun churn. Fourth, set the target by segment rather than as one blended goal, so a strong enterprise cohort cannot hide a bleeding small-business one.
Tie the target to growth so it stays concrete. SaaS Capital found that moving NRR from the 90-to-100 percent band into the 100-to-110 percent band lifts a company's growth rate by roughly 5 percentage points, and the relationship compounds as you climb.
Here is a worked target. A mid-market company runs a $60,000 ACV, sits at 101 percent NRR today, and has a GRR of 89 percent. The segment median is around 108 percent, so the raw gap is 7 points. The GRR is below the 90 percent floor, though, so the first move is retention, not upsell: lift gross retention to 91 or 92 percent by fixing the churn drivers, which alone pushes NRR toward 104. Then build expansion, through usage tiers or add-on modules, to close the rest and reach 108 to 110 percent over the year. Sequenced that way, the target is a plan instead of a wish.
Key takeaways
- A good NRR starts at 100 percent, and the private-market median sits just above it. SaaS Capital put bootstrapped companies near 103 percent, so growing the existing base a few points before adding a logo is the baseline, not an achievement.
- Segment sets the real bar. Enterprise medians run near 118 percent, mid-market near 108 percent, and small-business tools near 97 percent, so judge your number against your ACV tier and pricing model before calling it strong or weak.
- Best-in-class comes from expansion built into the product. Usage-based leaders like Snowflake clear 125 percent because spend grows with adoption, and disciplined teams calculate NRR by segment so a healthy headline cannot hide a leaking cohort.
- NRR is a valuation lever in its own right. Public companies above 120 percent traded at 11.7 times revenue in Q4 2024, nearly triple the multiple of those under 100 percent, because durable compounding is what the premium pays for.
- Read NRR with GRR, never alone. Gross retention shows how leaky the bucket is before expansion covers it, and a strong NRR sitting on a weak GRR means your growth depends on a few accounts you cannot afford to lose.
- Set the target from your segment, then check the floor. Anchor to your ACV-tier median, adjust for pricing, fix any gross-retention leak first, and target by segment so expansion has something solid to build on.
TAGS

Written by
Daniel SemeckyCo-founder & CEO
Daniel is the co-founder and CEO of Glimpze. He spends his days talking to revenue teams about how to catch high-intent visitors before they bounce, and writes about inbound sales, lead conversion, and building a motion where marketing and sales actually share a number.


