
On this page
Most sales teams do not lack data. They lack agreement on which numbers actually predict revenue, so the weekly review turns into a scroll through charts that nobody acts on.
A dashboard can show forty figures and still leave a manager guessing about next quarter. The fix starts earlier, with knowing which of those figures are key performance indicators and which are just background readings.
This guide covers what a sales KPI is, how KPIs differ from metrics, which ones matter most and how to calculate them, a worked example, the split between leading and lagging indicators, and a practical way to choose the handful worth watching.
What is a sales KPI?
A sales KPI is a quantifiable measure tied directly to a specific sales goal, used to show whether the team is on track to reach it. KPI stands for key performance indicator, and the word "key" carries the weight. A KPI is the specific figure that tells you, at a glance, whether a strategic objective is moving in the right direction. Pulling any number from a CRM does not make it key; the tie to a goal does.
Say the goal for the year is to grow new business revenue by 20 percent. A sales KPI for that goal might be new bookings per quarter measured against a target, or win rate on qualified opportunities. Each one connects an everyday activity to the outcome leadership cares about.
A useful KPI has four parts: a clear definition, a target, a time frame, and an owner. "Increase sales" is a wish. "Lift enterprise win rate from 18 to 24 percent by the end of Q4, owned by the enterprise sales lead" is a KPI you can manage against.
How do KPIs differ from metrics?
Every KPI is a metric, but most metrics are not KPIs, and the difference is whether the number is tied to a goal you are actively steering toward. A sales metric is any data point from the sales process: emails sent, calls dialed, page views, demos scheduled, proposals delivered. Metrics describe what is happening. KPIs tell you whether what is happening is good enough to hit the goal.
Think of the full metric set as every dial and gauge in a cockpit. You could read all of them, but only a few decide whether you reach the destination on time. Those few are your KPIs. The rest stay on the panel as context.
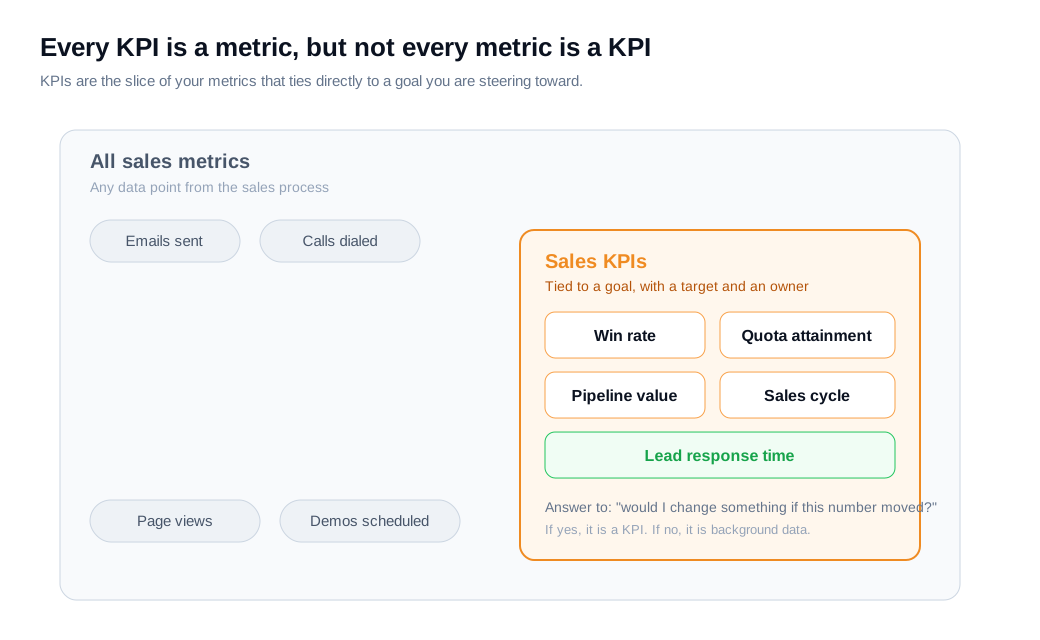
Here is the practical test. Emails sent is a metric. If your goal is 30 booked meetings a month and you set a target of 30, then meetings booked becomes a KPI, because you will change rep behavior the moment it dips. The same raw number can be a metric on one team and a KPI on another, depending on the goal it serves. As one plain summary puts it, KPIs set the direction and metrics help you steer.
Which sales KPIs matter most?
The sales KPIs that matter most are the ones that predict and explain revenue: win rate, average deal size, sales cycle length, pipeline coverage, quota attainment, and lead response time. These six give you a read on deal quality, pipeline health, team performance, and how fast opportunities move, which together decide whether you hit target.
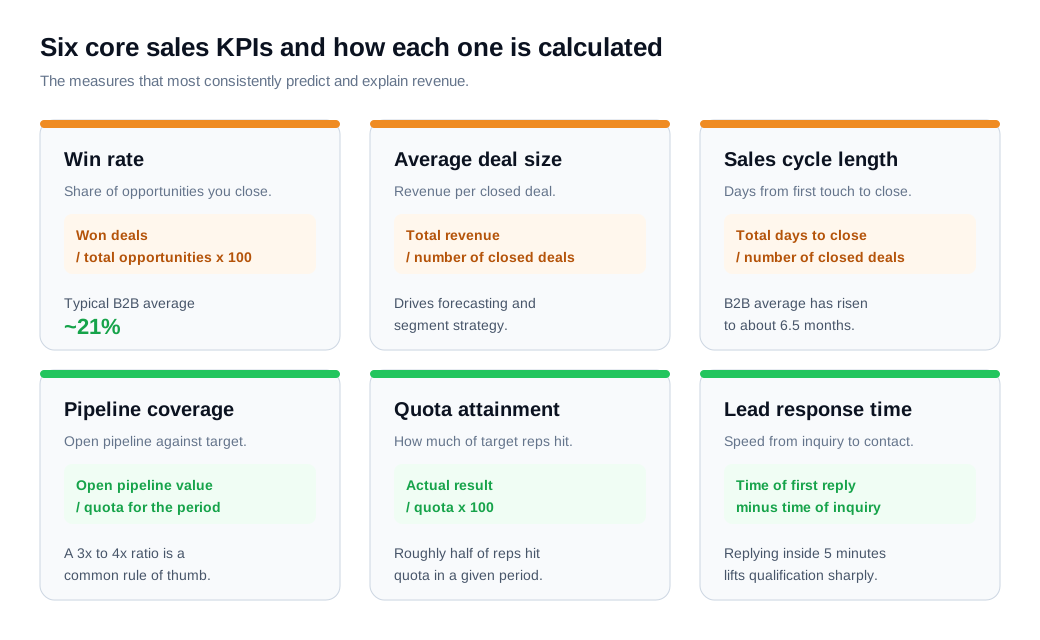
Win rate is the share of opportunities you close, calculated as won deals divided by total opportunities. Benchmarks vary by segment, but the average B2B team wins roughly 21 percent of its deals, which means about four in five opportunities end in a loss. Small movements here compound across the whole pipeline.
Average deal size is total revenue divided by the number of closed deals. It shapes forecasting and tells you which segments are worth more attention.
Sales cycle length is the average number of days from first touch to close. B2B cycles have stretched to around 6.5 months on average, up from under five years earlier, partly because buying committees have grown. A shorter cycle improves cash flow and forecasting.
Pipeline coverage compares open pipeline value against the quota for the period. Many teams look for a ratio of three to four times quota so there is enough in play to absorb the deals that slip.
Quota attainment is actual result divided by quota. Studies of B2B teams consistently show only about half of reps hitting quota in a given period, so this KPI flags both individual and system problems.
Lead response time is the gap between an inquiry arriving and a rep making contact. It belongs on this list because speed is one of the few levers that changes conversion before a deal even enters the pipeline. The classic Harvard Business Review audit of thousands of companies found that firms contacting a lead within an hour were nearly seven times more likely to qualify it than those that waited even one hour longer, and more than 60 times more likely than firms that waited a day. The odds of reaching a lead fall roughly 100 fold between a five minute and a 30 minute response. This is where fast channels matter for inbound sales: a tool like live chat that opens a conversation while the visitor is still on the page can pull response time down from hours to seconds.
How do you calculate sales KPIs, with a worked example?
You calculate most sales KPIs with simple division, and the real value comes from combining a few into sales velocity, which shows how much revenue your pipeline generates per day. Sales velocity multiplies opportunity volume, average deal size, and win rate, then divides by sales cycle length. It turns four separate KPIs into one number you can push on.
Take a team with 120 open opportunities in the quarter, an average deal size of 8,000 dollars, a 25 percent win rate, and a 45 day cycle. Sales velocity works out to (120 times 8,000 times 0.25) divided by 45, which is about 5,333 dollars of new revenue per day.
Now improve one lever. Coaching lifts win rate from 25 to 30 percent. Velocity climbs to (120 times 8,000 times 0.30) divided by 45, or about 6,400 dollars per day, a 20 percent gain from a five point change. Then trim the cycle from 45 to 38 days by responding faster and qualifying earlier, and velocity rises again to about 7,579 dollars per day. Two modest changes to two KPIs lifted daily output by more than 40 percent, which is the argument for tracking the levers rather than only the revenue they produce.
What is the difference between leading and lagging sales KPIs?
Leading KPIs predict future results and lagging KPIs report on results that already landed. Leading indicators cover the activity you control right now: meetings booked, new pipeline created, calls and emails, demos delivered, and lead response time. Lagging indicators cover outcomes you can only measure after the fact: closed revenue, win rate, quota attainment, churn, and customer lifetime value.
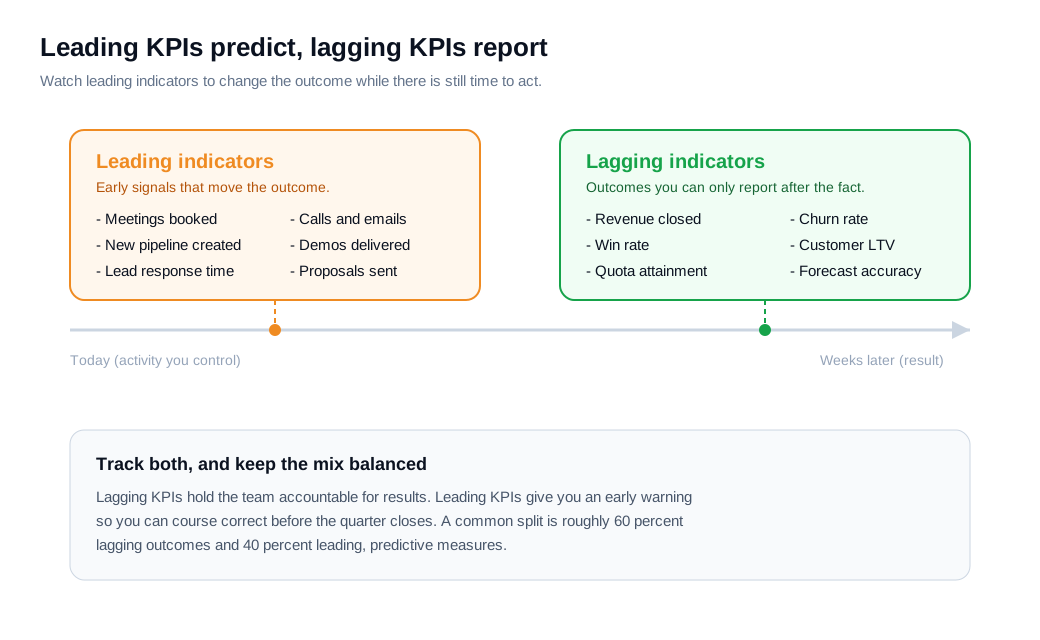
The distinction matters because lagging KPIs alone leave you reacting to a quarter that is already over. If revenue misses in March, there is nothing you can do about March. Leading KPIs give you an early warning in January, when there is still time to add pipeline or fix a stalled stage.
A healthy dashboard holds both. A common rule of thumb is to weight it toward outcomes for accountability while keeping enough predictive measures to steer, often around 60 percent lagging and 40 percent leading. When pipeline created (leading) drops for three straight weeks, you know a revenue miss (lagging) is coming and can act before it does.
How do you choose the right KPIs?
You choose the right KPIs by starting from a business goal and working backward to the smallest set of measures that shows progress toward it. Pick the goal first, then one or two lagging outcomes that define success, then the leading indicators that move those outcomes. If the goal is faster growth in a segment, the lagging KPI might be bookings in that segment and the leading KPI might be new qualified opportunities per week.
Run each candidate through the SMART test: specific, measurable, achievable, relevant, and time bound. "Increase sales" fails on nearly every count. "Raise mid market win rate from 22 to 27 percent by Q4" passes, because it names the number, the target, and the deadline, and you can collect the data to track it.
Then apply one blunt filter to every metric on the list: would you change something if this number moved? If a dip in the figure would not trigger a decision, it is context, not a KPI, and it belongs off the main view. Give every KPI you keep an owner, a target, and a review cadence, and make sure the underlying data is clean, since a KPI built on messy pipeline stages will mislead you. Good lead routing and notifications help here, because a response time KPI is only trustworthy if every inbound lead is captured and timestamped the same way.
How many sales KPIs should you track?
Most teams should track five to ten KPIs at a time, because focus beats coverage. Sources on dashboard design converge on this range, and the reasoning is consistent: when everything is a KPI, nothing is. Organizations often track fifty or more figures, yet only a small band of revenue linked indicators actually predict performance.
Watch for vanity metrics, the numbers that look impressive and drive no decision. Total emails sent, raw social impressions, and cumulative lifetime demos can all rise while revenue stalls. They pad a report without changing behavior. The test is the same one above: if the number cannot trigger an action, cut it from the main dashboard.
Fewer KPIs, reviewed on a set cadence and tied to owners, will move a team further than a wall of charts that reps glance past. Set the cadence to match the KPI: leading activity numbers reward a weekly look, while lagging outcomes like quota attainment make more sense monthly or quarterly. Start with a core set built around your current goal, prove the team acts on it, and add measures only when a new question demands one.
Key takeaways
- A sales KPI is a metric with a job. It ties to a specific goal and carries a definition, a target, a time frame, and an owner, which is what separates it from a raw data point.
- All KPIs are metrics, but few metrics are KPIs. The filter is whether you would change something if the number moved; if not, it is context.
- Six KPIs cover most of the ground. Win rate, average deal size, sales cycle length, pipeline coverage, quota attainment, and lead response time predict and explain revenue.
- Combine levers into sales velocity. Multiplying opportunities, deal size, and win rate and dividing by cycle length shows how small gains compound into daily revenue.
- Balance leading and lagging indicators. Lagging KPIs report results, leading KPIs warn you in time to act, and a healthy dashboard holds both.
- Track five to ten and cut the vanity metrics. Focus, ownership, and clean data beat a dashboard packed with numbers nobody acts on.
TAGS

Written by
Daniel SemeckyCo-founder & CEO
Daniel is the co-founder and CEO of Glimpze. He spends his days talking to revenue teams about how to catch high-intent visitors before they bounce, and writes about inbound sales, lead conversion, and building a motion where marketing and sales actually share a number.


