
On this page
Two stores send 20,000 visitors each to nearly identical pages and convert them at the same 2.5 percent. Both take 500 orders. One finishes the month with $17,000 in sales, the other with $26,000. Same traffic, same conversion rate, and a $9,000 gap.
The difference is average order value. One store's shoppers spend about $34 a basket, the other's spend about $52, and that single number decides how much revenue each order leaves behind. It is also one of the few growth levers you can move without buying a single extra click.
This guide covers what average order value means, how to calculate it, what a healthy benchmark looks like, how the number feeds profit, the tactics that raise it, where to set a free shipping threshold, and the traps that make the metric lie.
What is average order value?
Average order value (AOV) is the average dollar amount a customer spends in a single order over a defined period. It isolates basket size from the other two forces that build revenue, so you can see how much each transaction is actually worth without traffic or conversion rate clouding the read.
That separation matters because store revenue is really three numbers multiplied together: traffic, conversion rate, and average order value. Most teams pour their energy into the first two, chasing more visitors and higher conversion, while the third sits untouched. AOV is the term you can lift without spending more on ads or redesigning the funnel, which is why it tends to offer the fastest return per hour of work.
The metric is deliberately narrow, and that is its strength. It answers one question: when someone does buy, how big is the order? Because it is a single ratio, it travels well. You can track it month over month to see whether basket size is trending up, break it out by channel or device, or feed it into bigger models like customer lifetime value. Most teams exclude taxes, shipping, and refunds from the calculation so the figure reflects what customers actually spend on products, a point TrueProfit makes in its guide to the metric.
How do you calculate AOV?
You calculate average order value by dividing total revenue for a period by the total number of orders in that same period: AOV = total revenue divided by number of orders. Every reputable source, from Shopify to Wall Street Prep, states the formula the same way, so the arithmetic is never the hard part.
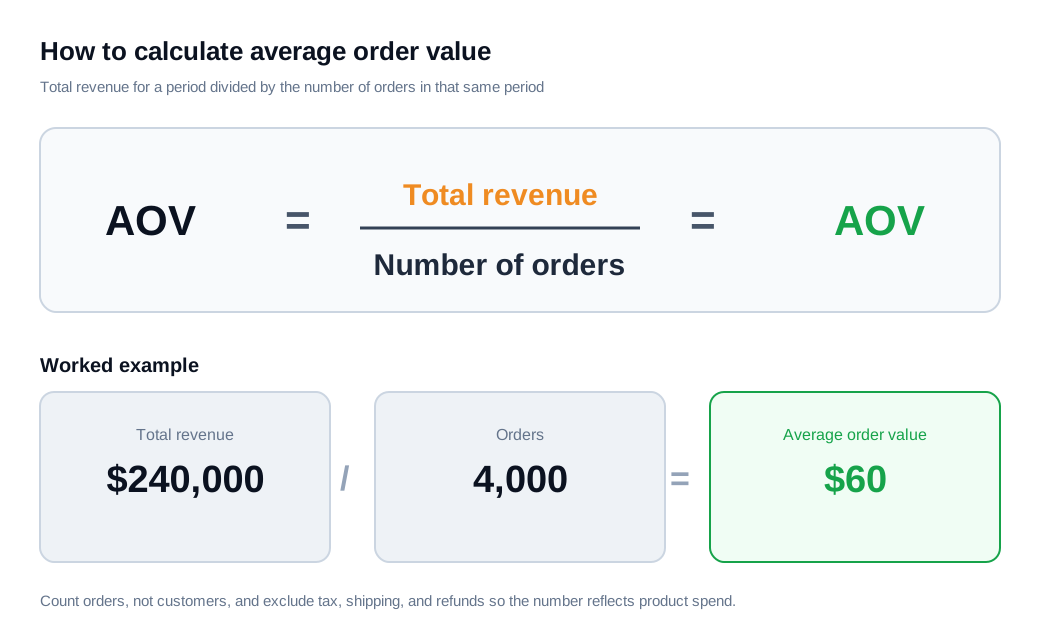
Here is a worked example. Say your store books $240,000 in revenue across 4,000 orders in a quarter. Divide $240,000 by 4,000 and you get an AOV of $60. If the next quarter brings $290,000 across 4,100 orders, AOV rises to about $71, because revenue grew faster than order count did.
Two details decide whether the number is honest. First, count orders, not customers. A shopper who buys twice in the period is two orders, not one, so AOV measures the transaction rather than the person. Second, be consistent about what goes into revenue. If you strip out shipping and tax one month and leave them in the next, the trend line will move for reasons that have nothing to do with basket size. Pick one definition, write it down, and hold it steady so the number stays comparable across periods.
What is a good average order value benchmark?
There is no universal AOV benchmark, because the right number depends heavily on what you sell, on which device, and to whom. The global cross-store figure lands somewhere around $150, but that average blends a $12 candle order and a $2,000 sofa order into one meaningless midpoint, so it works as a sanity check and nothing more.
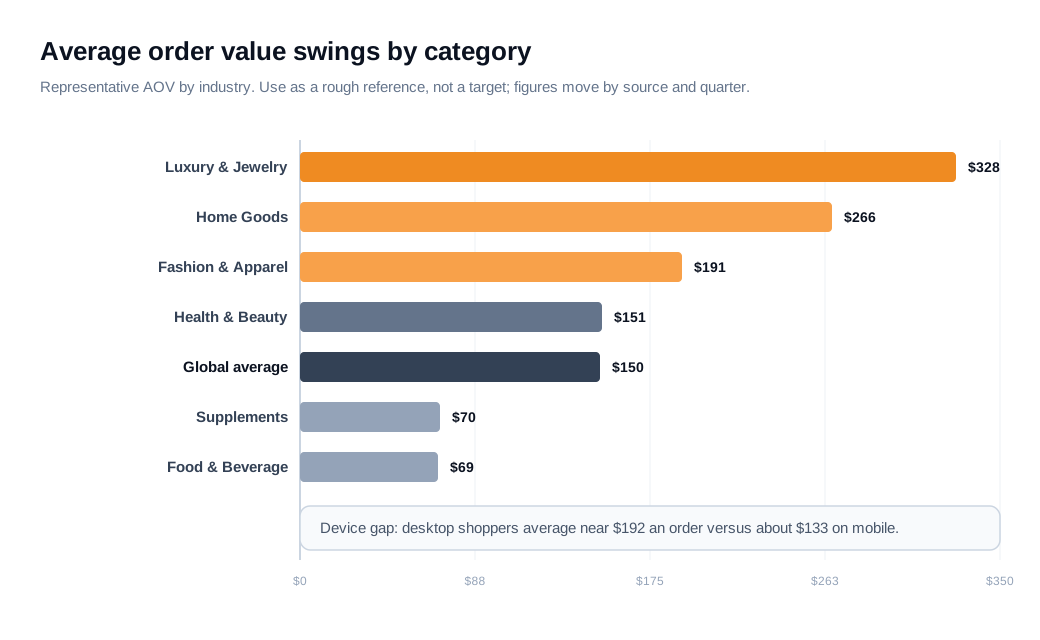
Category is the biggest driver. ClickPost's 2026 benchmark data shows expensive, considered purchases sitting far above cheap, habitual ones. Luxury and jewelry commonly report an AOV above $300, home goods land near $266, fashion and apparel near $191, health and beauty near $151, while supplements and food and beverage sit closer to $70. Those figures move by source and quarter, so treat any single chart as a rough reference rather than a target.
Device and buyer type pull the number too. Desktop shoppers tend to spend more per order than mobile shoppers, often near $192 against $133, according to figures compiled by WiserReview, partly because people browse on phones and commit on laptops. B2B orders dwarf B2C ones, since a routine restock can run several hundred dollars against a $60 to $150 consumer basket. The practical takeaway is that your own trend line is the benchmark worth chasing. An AOV climbing quarter over quarter while conversion holds tells you more than any comparison to a competitor in a different category ever could.
How does AOV affect profitability?
Average order value drives profitability because a large slice of the cost behind every order is fixed per order, so a bigger basket spreads those costs over more revenue and drops more contribution to the bottom line. Some costs scale with what a shopper buys, like the cost of the goods. Others barely move whether the order is $40 or $90: the pick-and-pack labor, the fixed portion of a payment fee, and above all the cost you paid to acquire that customer.
Acquisition cost is the key one. Whether a shopper spends $40 or $90, the ad click that brought them in cost the same. That means every extra dollar of basket size, minus its product cost, falls almost straight through to contribution. Common Thread Collective frames the same idea from the other direction: your contribution margin sets the ceiling on what you can afford to spend to acquire a customer, so a higher AOV widens that ceiling and makes first-order profitability reachable. As the team at Ecommerce Optimizers puts it, dollars fund a business, not percentages, and a bigger basket generates more absolute contribution dollars even at the same margin rate.
Work the numbers. Suppose your gross margin is 50 percent, fulfillment costs $6 an order, and it costs $20 in ad spend to win each order. At a $40 AOV, gross profit is $20, minus $6 fulfillment and $20 acquisition, which leaves a $6 loss on the first order. Now raise the basket to $70 with everything else held constant. Gross profit becomes $35, and after the same $6 and $20 you clear $9 in profit. The margin percentage never changed, and the acquisition cost never changed. The larger order flipped a money-losing sale into a profitable one, which is the advantage a bigger basket gives you.
What tactics raise AOV?
The reliable tactics all do one thing: they get a willing buyer to add more to an order they were already going to place, through bundles, cross-sells, upsells, post-purchase offers, and a free shipping threshold. None of them require a single new visitor, which is what makes AOV such an efficient lever compared with buying more traffic.
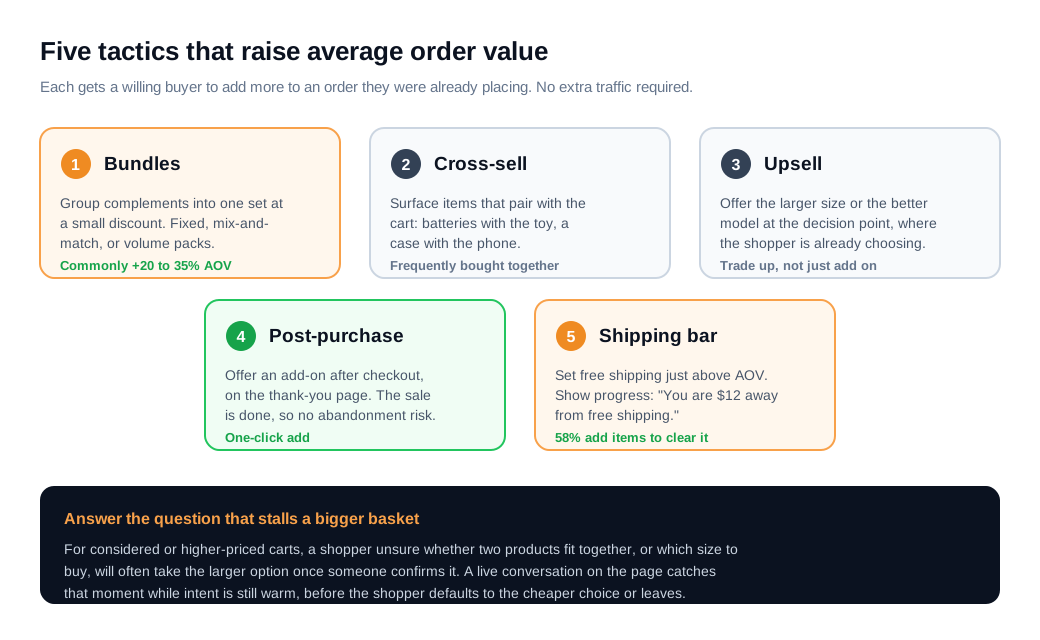
Bundling is the workhorse. Group complementary items into a single set at a small discount, whether a fixed kit like a skincare routine, a mix-and-match deal such as any three tees for $60, or a volume pack that lowers the per-unit price. Bundles simplify the decision and raise perceived value, and Ringly's 2026 ecommerce data reports lifts in the range of 20 to 35 percent when they are built with intent. Cross-selling works alongside it by surfacing items that pair with the cart, the batteries next to the toy or the case next to the phone, while upselling nudges the shopper toward a larger size or better model at the moment they are already choosing.
Timing matters as much as the offer. A post-purchase upsell, shown after checkout on the thank-you page, is the one moment with zero abandonment risk, because the original sale is already complete and the shopper adds the extra item with one click. Rebuy's tactics roundup stresses that recommendations perform best when they are driven by real purchase data rather than generic picks.
For considered or higher-priced carts, the fastest way to lift a single order is often to answer the one question holding the shopper back. Someone deciding between the 32-inch and the 40-inch model, or unsure whether two products work together, will frequently take the larger option once a person confirms it. Offering live chat on the product and cart pages catches that moment while intent is warm, and for higher-value baskets a quick call handled like an inbound sales conversation can move a hesitant buyer up a tier rather than down to the cheapest option.
Where should you set a free shipping threshold?
Set the free shipping threshold a bit above your current average order value, commonly 20 to 30 percent higher, so most orders fall just short and shoppers add an item to clear the bar. Around 58 percent of shoppers will add extra items to a cart to qualify for free shipping, according to SellersCommerce's shipping research, which is why a well-placed threshold is one of the most dependable AOV tactics available.
Here is how to size it. If your AOV is $70, setting free shipping at $89 puts the bar close enough that a shopper with a $70 cart only needs one more small item to reach it. Show the gap explicitly with a progress message like "You are $12 away from free shipping," since the nudge only works if the shopper can see how close they are. Set the bar too high and it feels out of reach, so orders stay put; set it below your AOV and you give away shipping on baskets that would have cleared it anyway.
Watch the margin math, because free shipping is a cost you absorb. If lifting the threshold nudges a $70 order to $90, the extra $20 has to cover both its own product cost and the shipping you now eat, or the higher AOV comes at a thinner margin. The tactic pays off when the added items carry enough contribution to fund the shipping, which is usually the case when you steer shoppers toward high-margin accessories rather than another discounted core product.
What mistakes should you avoid when raising AOV?
The most common mistake is chasing average order value in isolation, because several tactics that lift the average can quietly shrink margin, conversion, or order count at the same time. A higher AOV at a lower margin can leave you with fewer real dollars than before, so the number going up is not proof the business got healthier.
Deep discounting to hit a bundle price is the usual culprit. If a bundle raises AOV by 15 percent but you cut the price 25 percent to sell it, contribution per order falls even as the headline metric climbs. Aggressive upsells carry a different risk: pile too many offers into the cart and checkout, and you slow the path to purchase enough to dent conversion, which can cost more orders than the upsells add.
Blended averages hide the rest. A single store-wide AOV can be dragged up by a handful of large orders while the typical basket barely moves, so watch the median next to the mean, and segment by channel, device, and new versus returning customers. A blended figure that looks healthy can mask a mobile experience converting small baskets or a paid channel bringing in bargain hunters. Read AOV alongside conversion rate and contribution margin, never on its own, and you will catch the tactics that trade one gain for a hidden loss before they cost you.
Key takeaways
- AOV is revenue per order over a period, calculated as total revenue divided by number of orders, and it isolates basket size from traffic and conversion rate.
- The definition decides the number, so count orders rather than customers and hold a consistent rule on whether tax and shipping belong in revenue.
- Benchmarks swing by category, device, and buyer, from under $70 for food and supplements to above $300 for luxury, which makes your own trend line the target that matters.
- Higher AOV compounds into profit, because fixed per-order costs like acquisition spread across a bigger basket and widen the margin that funds growth.
- Five tactics reliably lift AOV: bundles, cross-sells, upsells, post-purchase offers, and a free shipping threshold set just above your current average.
- Raise AOV without watching margin and conversion, and the metric will lie, so segment the number and read it next to contribution and conversion rate.

Written by
Nilas MylerCo-founder & CTO, Glimpze
Nilas is the co-founder and CTO of Glimpze, an inbound sales tool that turns high-intent website visitors into live conversations. A former SEO consultant for some of the largest companies in Denmark, he writes about speed-to-lead, inbound sales, and conversion rate optimization — the technical and operational mechanics of turning traffic into pipeline.


