
On this page
Two SaaS companies each end the year at $10 million in ARR, then stop signing new customers for twelve months. One starts the next year at $11 million from the same accounts. The other drops to $9 million. Same product, same logos, no new deals on either side. Everything that moved happened inside the base they already had.
That movement is net revenue retention, and it is one of the first numbers a serious investor asks for. It measures whether the customers you already won are worth more or less to you a year later, which is another way of asking whether your growth compounds or quietly leaks.
This post covers what NRR is, how to calculate it with a worked example, what a good number looks like by segment, how it differs from gross revenue retention, why investors weight it so heavily, and the levers that actually move it.
What is net revenue retention?
Net revenue retention is the percentage of recurring revenue a business keeps and grows from its existing customers over a period, after expansion, contraction, and churn, and before any revenue from new customers. It answers a narrow but important question: take the customers you had a year ago, forget everyone you have signed since, and ask whether that group pays you more or less today.
The metric isolates the install base on purpose. New-logo growth can paper over a leaky product for a while, because fresh customers refill the bucket faster than the old ones drain out. NRR strips that cover away and shows what the base does on its own, which is why Stripe's overview of net revenue retention treats it as a core read on how much value customers get after they buy.
Read the number against 100 percent. Above 100 percent, your existing customers generate more this year than last, so the base grows before a single new deal closes. Below 100 percent, the base is shrinking, and every new sale has to refill it before it adds anything on top. Most teams measure NRR on ARR or MRR over a trailing twelve months, though quarterly figures annualized are common too.
How do you calculate NRR?
You calculate NRR by taking the recurring revenue from a group of customers at the start of a period, adding expansion, subtracting contraction and churn, and dividing the result by the starting revenue. The formula is short. The discipline is in defining the four pieces the same way every time.
NRR = (Starting ARR + Expansion - Contraction - Churn) / Starting ARR.
The four inputs each mean something specific:
- Starting ARR. The recurring revenue from a fixed cohort of existing customers at the beginning of the period. This is the denominator, and it never includes anyone who signed after the period began.
- Expansion. Extra recurring revenue from that same cohort through upgrades, added seats, higher usage, and cross-sells. This is the only term that can push NRR above 100 percent.
- Contraction. Revenue lost from customers who stayed but shrank, through downgrades, fewer seats, or renegotiated prices.
- Churn. Revenue lost from customers in the cohort who canceled outright.
Here is a worked example for a B2B SaaS company over one year. The cohort starts at $2,000,000 in ARR. Over the next twelve months the same customers add $360,000 in expansion, give back $60,000 to downgrades, and cancel $140,000 outright.
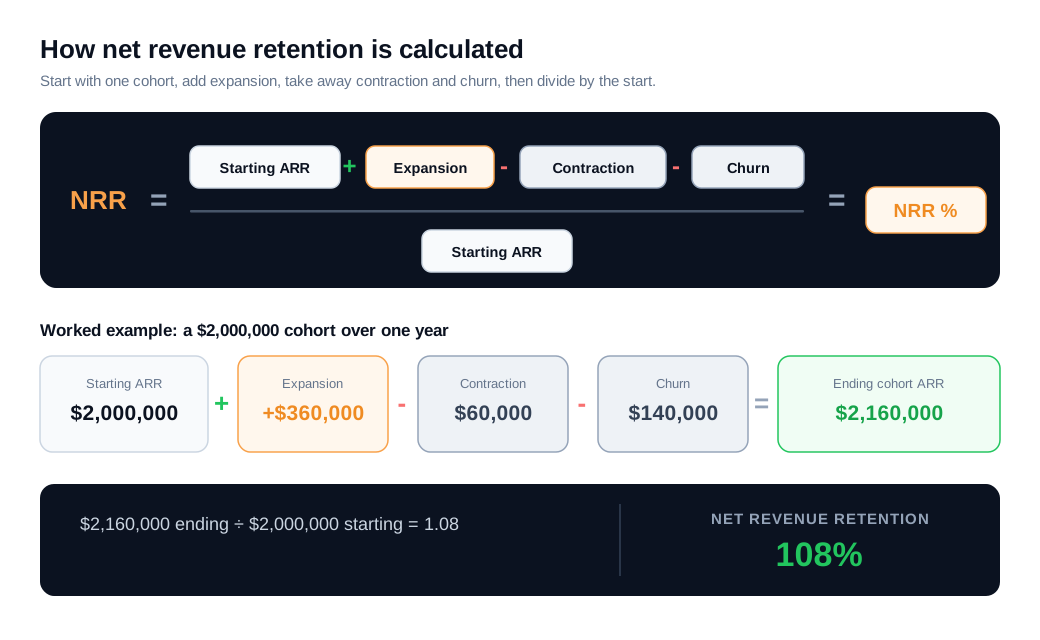
Run the numbers. Starting ARR of $2,000,000 plus $360,000 in expansion is $2,360,000. Take away $60,000 of contraction and $140,000 of churn and you are left with $2,160,000. Divide that by the $2,000,000 you started with and NRR is 1.08, or 108 percent. The cohort is worth 8 percent more than it was a year ago, and the company counted no new customers to get there, in line with the standard approach Wall Street Prep lays out for the NRR formula.
One rule keeps the number honest: new-customer revenue never enters either side of the fraction. The moment this quarter's fresh logos leak into the calculation, NRR stops measuring retention and starts flattering you. Pick a cohort, hold the window steady, and measure the same way every period.
What is a good NRR benchmark?
A good NRR clears 100 percent, healthy sits near 110 percent, and best-in-class SaaS runs above 120 percent, though the honest benchmark bends with your segment, deal size, and pricing model. A number that is excellent for a self-serve SMB tool would be mediocre for an enterprise platform.
Recent private-company data puts the median in a tight band. SaaS Capital's 2025 retention research pegs median NRR near 102 percent for companies with average contract values between $25,000 and $50,000, with the broader private B2B SaaS median hovering around 100 to 106 percent depending on the sample.
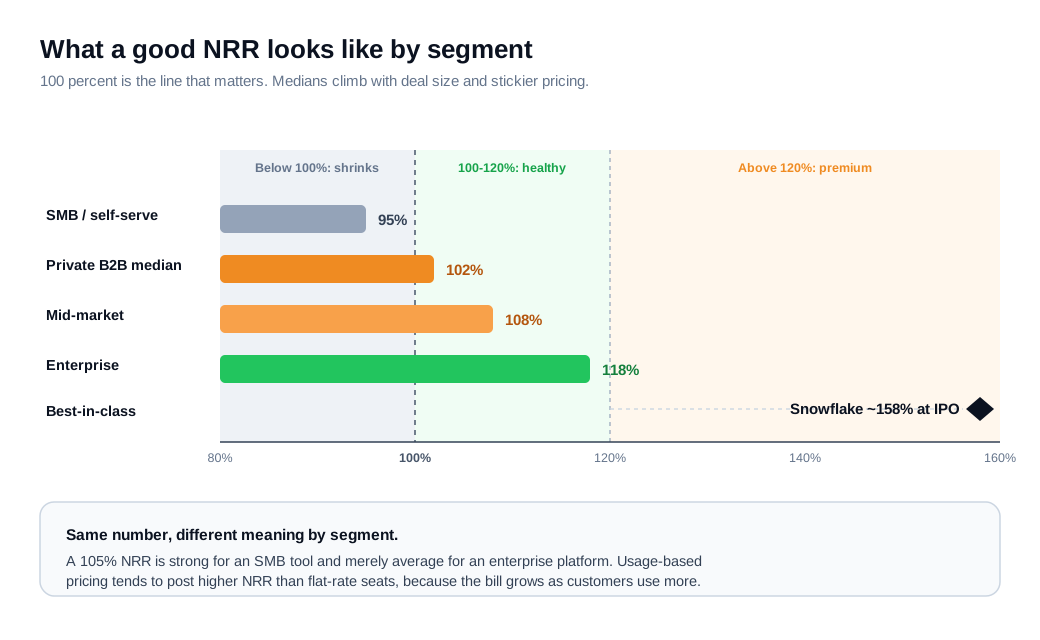
Segment pulls the number around. Enterprise motions, where a single account can add seats and modules for years, tend to run highest, with medians near 118 percent. Mid-market lands in the low 100s. SMB and self-serve products sit lower, often between 90 and 105 percent, because small customers churn more and expand less. Pricing model matters too, since usage-based products, where a customer's bill grows as they consume more, routinely post higher NRR than flat-rate seat licenses.
The reason the benchmark is worth chasing shows up in growth. SaaS Capital found a strong, compounding link between retention and growth rate: moving from the 90-to-100 percent NRR band up to the 100-to-110 percent band is associated with roughly five extra points of annual growth, and the companies with the highest retention grow far faster than the median. That reframes retention as a growth lever you invest in rather than a defensive number you monitor.
What is the difference between NRR and gross revenue retention?
The difference is expansion. Gross revenue retention (GRR) counts only the revenue you keep after churn and downgrades and can never top 100 percent, while net revenue retention adds expansion back in and can run well above it. GRR measures the floor under your revenue. NRR measures whether the base grows on top of that floor.
Return to the worked example. The cohort started at $2,000,000, lost $60,000 to contraction and $140,000 to churn, and added $360,000 in expansion. GRR ignores that expansion entirely: $2,000,000 minus $60,000 minus $140,000 is $1,800,000, and $1,800,000 divided by $2,000,000 is 90 percent. NRR, with the $360,000 of expansion counted, is 108 percent. The 18-point gap between them is precisely the expansion the cohort generated, which is the split Stripe draws between net and gross revenue retention.
Read together, the two numbers tell you where to work. A high GRR and a high NRR mean a sticky product that customers also grow into. A low GRR propped up by a high NRR is a warning, because a few big accounts are expanding fast enough to hide meaningful churn underneath, and that mix is fragile. Watch GRR to protect the base and NRR to grow it.
Why does NRR matter to investors?
NRR matters to investors because it is the cleanest single read on product-market fit and capital efficiency, and because it compounds. Revenue that expands out of the existing base carries almost no acquisition cost, so a company above 100 percent grows even when it pauses new sales, and it does so cheaply.
Start with the efficiency point. Winning a new customer costs real money in sales and marketing. Expanding an existing one who already trusts the product costs a fraction of that, which is why expansion is some of the most profitable growth a SaaS company can book. A business that leans on expansion needs less capital to hit the same growth rate as a peer that has to buy every dollar of new revenue.
Then the compounding. NRR runs on the same customers year after year, so small differences swing wildly over time. Take a $1,000,000 cohort and sign no new customers for five years. At 90 percent NRR it decays to about $590,000. At 100 percent it holds flat. At 110 percent it grows to roughly $1.61 million, and at 120 percent it reaches about $2.49 million.
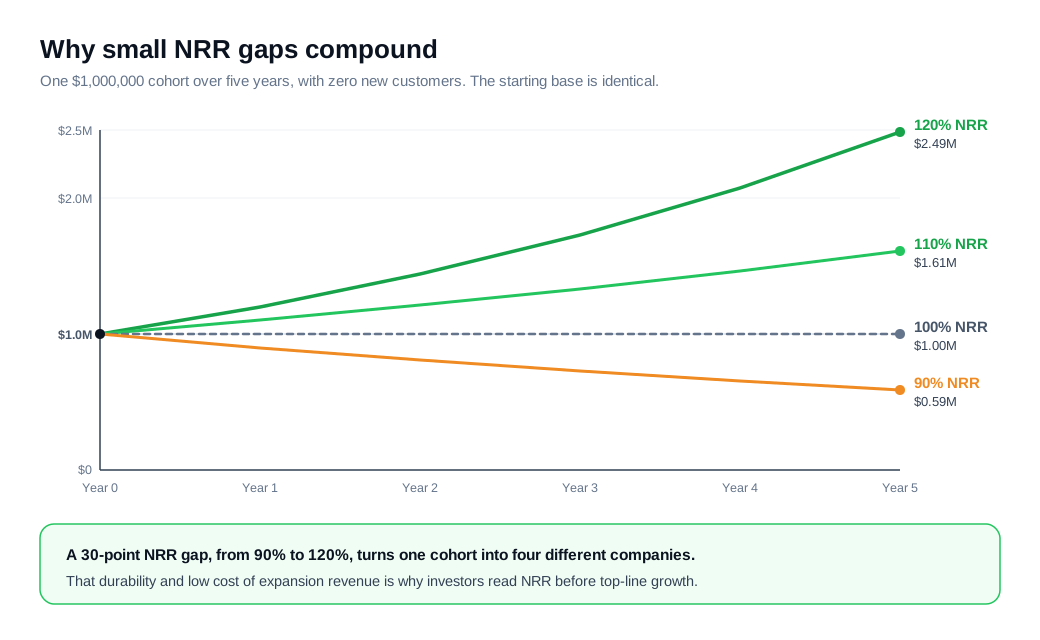
Same starting base, four very different companies five years on, driven entirely by what happens inside the install base. That is why the metric shows up in valuations. Analyses of public SaaS companies consistently find that businesses with NRR above 120 percent command materially higher revenue multiples than otherwise similar peers stuck near 100 percent, because their growth is more durable and cheaper to sustain, a link documented in both m3ter's work on NRR and SaaS valuations and FE International's SaaS valuation guide.
The benchmark cases are famous. Snowflake reported net revenue retention around 158 percent at its 2020 IPO, powered by consumption-based pricing that let customer bills grow as workloads moved onto its platform, with no upsell conversation required, as a teardown of Snowflake's S-1 filing walks through. Numbers that high are rare, but they explain why investors treat NRR as a proxy for how good a business really is underneath the top-line growth.
How do you improve NRR?
You improve NRR by working both ends at once, cutting the churn and contraction that drag it down while driving the expansion that lifts it above 100 percent. One without the other stalls. A team that chases upsells while the base leaks will run in place, and a team that plugs churn but never expands will cap out just under 100 percent.
A practical set of moves, roughly from foundation to upside:
- Get customers to value fast. Most churn is set in the first 90 days, when a customer either reaches the outcome they bought or drifts away. Onboarding that drives each account to a concrete first result, quickly, is the highest-leverage churn work you can do.
- Watch usage and act before renewal. Declining logins, unused seats, and dropped features are churn showing up early. Teams that monitor account health and reach at-risk customers 60 to 90 days ahead of renewal, rather than at the cancellation screen, routinely cut churn by a meaningful margin.
- Build expansion into the pricing. The easiest expansion is the kind a customer grows into without a negotiation: more seats, more usage, a higher tier unlocked by success with the product. Pricing that scales with the value a customer gets turns ordinary adoption into retention.
- Run expansion at renewal. Treat every renewal as a structured conversation about what the account needs next instead of a silent auto-charge. The customers most ready to expand are usually the ones already succeeding with what they have.
- Take friction out of support. Every unanswered question is a small withdrawal from the relationship, and enough of them end in contraction or a canceled contract.
That last point is where day-to-day customer experience meets the metric. A customer stuck on a problem who has to file a ticket and wait is a customer drifting toward the exit, while one who gets a real answer in the moment stays and, often, buys more. Offering live chat inside the product, with the option to escalate to a live video call or screen share when a problem is faster to show than to type, closes those gaps before they turn into contraction. The same live conversations surface expansion signals early, since a customer asking how to do more is telling you they are ready to, which is exactly the moment an inbound sales motion built on speed can turn interest into an upgrade. Retention and expansion both come down to the quality and speed of the conversations you have with the customers you already have.
Key takeaways
- NRR tracks only the customers you already have, measuring whether that base is worth more or less a year later after expansion, contraction, and churn, with new logos left out on purpose.
- The formula is short, (Starting ARR + expansion - contraction - churn) divided by Starting ARR, and it stays honest only if new-customer revenue never sneaks into either side.
- 100 percent is the line that matters, with median private B2B SaaS around 100 to 106 percent, healthy near 110 percent, and best-in-class above 120 percent, all shifting by segment and pricing model.
- GRR and NRR answer different questions, since GRR caps at 100 percent and shows the floor under your revenue while NRR adds expansion and shows whether the base grows on top of it.
- Investors weight NRR because it compounds and is cheap, as a $1 million cohort at 120 percent NRR becomes about $2.49 million in five years with no new customers, and high-NRR companies earn richer valuation multiples.
- You raise NRR from both sides at once, cutting churn with fast onboarding, health monitoring, and low-friction support, while driving expansion through pricing that scales and real renewal conversations.
TAGS

Written by
Daniel SemeckyCo-founder & CEO
Daniel is the co-founder and CEO of Glimpze. He spends his days talking to revenue teams about how to catch high-intent visitors before they bounce, and writes about inbound sales, lead conversion, and building a motion where marketing and sales actually share a number.


