
On this page
- What is the SaaS magic number?
- Where did the SaaS magic number come from?
- How do you calculate the SaaS magic number?
- What does a good magic number indicate?
- How does the SaaS magic number relate to CAC payback period?
- How do you use the SaaS magic number for growth decisions?
- What are the limitations of the SaaS magic number?
- Key takeaways
- Sources
A founder finishes a strong quarter and walks into a board meeting with one question waiting for them: should the company double the sales and marketing budget or hold it flat. Revenue grew, the pipeline looks full, and everyone at the table has an opinion. The magic number answers with a single ratio instead of a debate.
It takes the extra revenue a quarter of growth produced, annualizes it, and divides by what the company spent to win it. When the answer clears a certain line, the money going into growth is coming back fast enough to justify spending more. When it falls short, adding budget just buys more of a motion that already loses money.
This post covers what the SaaS magic number is, where it came from, how to calculate it with a worked example, what score counts as good, how it connects to CAC payback and gross margin, how to use it to time growth decisions, and where the metric quietly misleads.
What is the SaaS magic number?
The SaaS magic number is a sales efficiency metric that measures how much new annualized revenue a company generates for every dollar it spent on sales and marketing the previous quarter. It is a ratio, so a score of 1.0 means each dollar of prior-quarter spend produced a dollar of new annual revenue run rate.
Below 1.0, every dollar of spend bought less than a dollar of annual revenue. Above 1.0, it bought more. That single number turns a messy question about growth efficiency into something you can compare across quarters and against other companies, as Wall Street Prep lays out in its formula and calculator.
The appeal is partly practical. Because the standard version is built from reported GAAP revenue, it can be calculated for any public SaaS company from its financial statements, which makes it comparable in a way that internal metrics rarely are, as Klipfolio notes in its overview.
What the magic number is really answering is a capital-allocation question. Not whether you grew, but whether the growth was cheap enough to keep funding. That framing is why investors reach for it first when a founder asks for permission to spend.
Where did the SaaS magic number come from?
The magic number traces back to Scale Venture Partners in 2005, when partner Rory O'Driscoll was studying Omniture, a web analytics company run by Josh James. He was comparing the company's revenue traction against what it spent to get there.
Omniture was generating more than $2 of first-year revenue for every $1 invested in its go-to-market engine, and O'Driscoll reportedly reacted with two words: "It's magic." The name stuck, and Scale Venture Partners tells the origin story in its history of the metric. Investor Lars Leckie popularized it in 2008 as a quick test of whether a SaaS company was ready to pour money into growth.
One design choice from those early days still matters. The metric was deliberately built on GAAP revenue rather than a private internal figure, so it stays freely available for public companies and comparable between them, as Scale Venture Partners explains in its breakdown of the math. That decision is why the magic number became a shared language between founders and the people funding them.
How do you calculate the SaaS magic number?
You calculate the SaaS magic number by taking the change in quarterly revenue, multiplying it by four to annualize it, and dividing by the previous quarter's sales and marketing spend. Written out, the formula is short:
Magic number = ((current quarter revenue minus previous quarter revenue) x 4) / previous quarter's sales and marketing spend.
Two choices in that formula are worth understanding, because they are where people get confused. The first is annualizing the quarterly growth by multiplying it by four, which turns a single quarter of gain into a full-year run rate you can weigh against annual-scale spending. The second is using the previous quarter's spend rather than the current one.
That lag is intentional. Sales and marketing effort in one quarter attracts customers whose revenue mostly shows up in the following quarter, so the fair comparison is this quarter's growth against last quarter's spend, as Scale Venture Partners describes it. You spend the cash first and collect the revenue after.
Here is a worked example. A company reports $4,000,000 of revenue in Q1 and $4,600,000 in Q2, so revenue grew by $600,000. Annualize that by multiplying by four and you get $2,400,000. The company spent $3,000,000 on sales and marketing in Q1. Divide $2,400,000 by $3,000,000 and the magic number is 0.8.
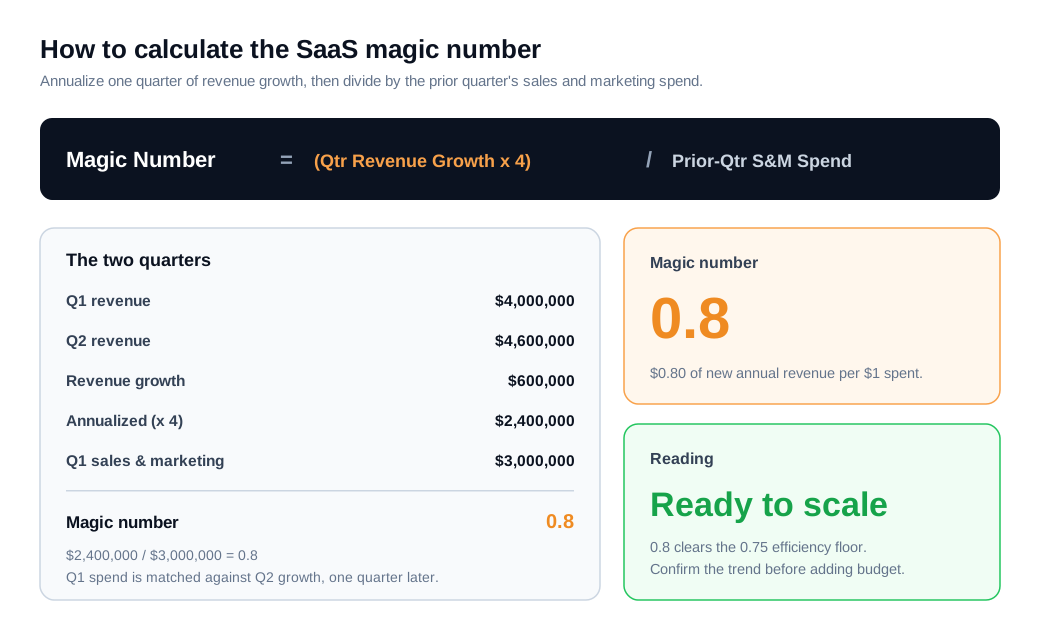
A score of 0.8 means every dollar the company put into sales and marketing in Q1 produced 80 cents of new annual revenue. Some teams swap GAAP revenue for net new ARR to get closer to the underlying subscription growth, and the arithmetic works the same way, as The SaaS CFO shows in its walkthrough. Pick one revenue definition and hold it steady, so your quarters stay comparable.
What does a good magic number indicate?
A magic number above roughly 0.75 indicates that sales and marketing spend is efficient enough to justify scaling, while a number below 0.5 signals the growth motion is losing money and should be fixed before more budget goes in. The commonly cited bands run in four steps.
Above 1.0 is highly efficient, and the business is primed to pour on spend. Between 0.75 and 1.0 is healthy, and most investors treat it as the threshold where a company is ready to scale. Between 0.5 and 0.75 is workable but has room to improve. Below 0.5 usually points to a deeper problem in the motion, as CloudZero sets out in its interpretation of the ranges.
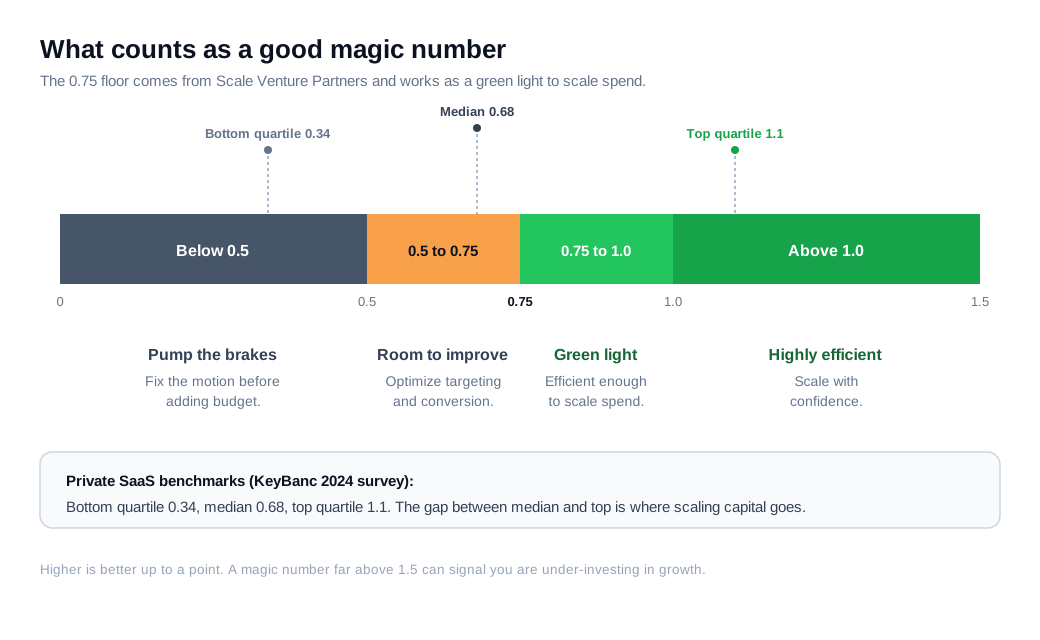
The 0.75 line is worth treating as a floor to clear, not a target to aim at. It originated with Scale Venture Partners and was adopted by other institutional investors as the point where they view a company as ready to push the throttle on growth. Below 0.5, the original guidance was to pump the brakes.
Real companies mostly sit under that line. Across private SaaS companies in the KeyBanc Capital Markets 2024 survey, reported in Aleph's benchmark roundup, the median magic number was about 0.68, with the top quartile near 1.1 and the bottom quartile at 0.34. The distance between a median company and a top-quartile one is large, and the gap in fundraising outcomes between a 0.7 and a 1.0 is larger still.
Higher is better only up to a point. A magic number far above 1.5 can mean the company is starving its growth, leaving revenue on the table that a more aggressive competitor will take. Very efficient and very small is a common trap, and the metric will not warn you about it.
How does the SaaS magic number relate to CAC payback period?
The magic number and CAC payback period measure the same efficiency from two angles, and you can convert between them once you add gross margin: CAC payback in months equals 12 divided by the magic number times gross margin. The magic number gives a portfolio-level read on spend productivity, and payback translates it into a customer-level recovery timeline.
Run the numbers from the earlier example. The magic number was 0.8, and say gross margin is 75 percent, a common SaaS figure. Payback is 12 divided by (0.8 times 0.75), which is 12 divided by 0.60, or 20 months to recover the sales and marketing spend, as Fiscallion works through the same bridge.
Gross margin is the reason you need both. The magic number ignores the cost of delivering the product, so a company can post a clean 1.0 and still lose money on every customer if its hosting, support, and services costs are high. Pairing the ratio with a margin-adjusted metric closes that blind spot.
When the two disagree, the gap is informative. A healthy magic number sitting next to a payback period over 24 months almost always means gross margin is low or churn is dragging down the net revenue growth in the numerator. That mismatch tells you where to look before you touch the spending dial.
How do you use the SaaS magic number for growth decisions?
You use the magic number as a throttle: when it sits above about 0.75, the efficient move is to increase sales and marketing spend, and when it drops below 0.5, the move is to pull back and repair the motion before adding any budget. Between those lines, hold spend roughly steady and work on efficiency.
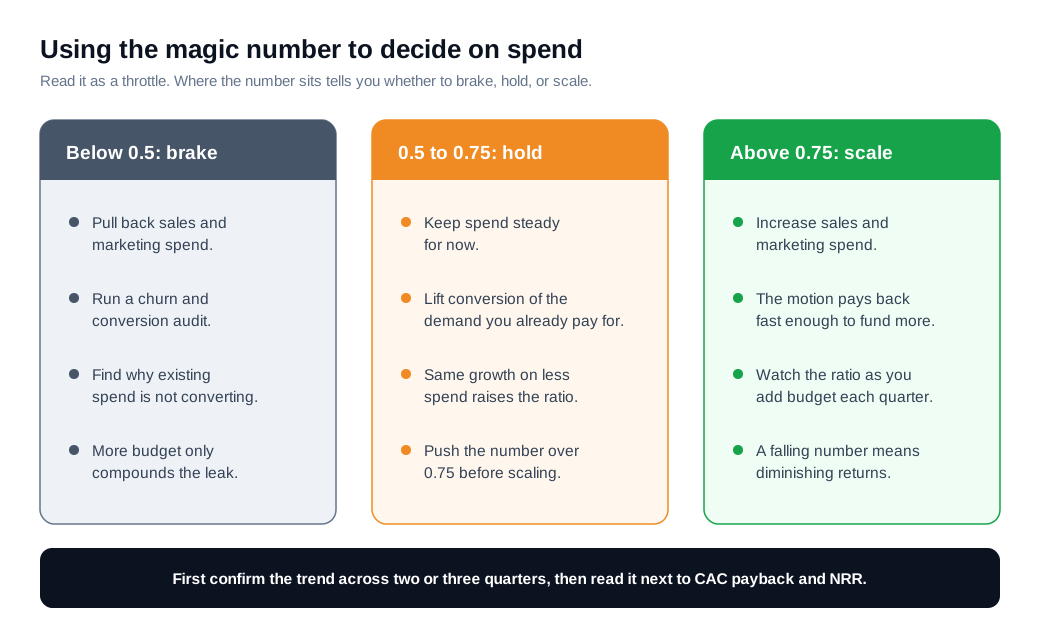
Read it as a trend, not a single snapshot. A magic number that rises quarter over quarter as you add spend says the motion is holding up as you scale. One that falls as you spend more says you are hitting diminishing returns, and each new dollar is buying less growth than the last. The direction over three or four quarters tells you more than any one reading.
There are two ways to lift the number, and they pull on different levers. You can spend less to get the same growth, which shrinks the denominator. Or you can get more growth from the same spend, which grows the numerator, and that second lever is usually the bigger one because it runs straight through conversion.
New revenue is downstream of how many interested visitors turn into customers, so raising the conversion rate on traffic you already pay for lifts the numerator without adding a cent of spend. A large share of that traffic is high-intent visitors comparing options right now, and reaching them in the moment, with live chat on a pricing page or a live video call when a question is easier to show than to type, converts more of them than a contact form and a next-day reply. That speed is the core of an inbound sales motion, and it shows up in the revenue growth the magic number divides by spend.
One guardrail. A single strong quarter is not a reason to scale, because a lumpy enterprise deal can flatter the ratio for one period. Confirm the trend, then read the magic number alongside CAC payback and net revenue retention, since Fiscallion puts it plainly that a magic number without those context metrics is a number without a decision attached to it.
What are the limitations of the SaaS magic number?
The magic number's biggest limitation is that it credits all revenue growth to sales and marketing, ignores gross margin and churn, and can be thrown off by the timing of a few large deals. Each of those gaps is worth naming, because the metric will not flag them for you.
The first is attribution. The formula assumes last quarter's spend drove this quarter's growth, but product-led signups, word of mouth, and expansion from existing customers all move revenue without any matching spend, which can inflate the ratio, as Drivetrain points out in its review of when to use the metric. A company with strong organic growth will look more efficient than its paid motion really is.
The second is that a single number hides the mix. A healthy magic number can sit on top of a leaky bucket if high churn is quietly cancelling out strong new sales, and the ratio alone will not show it. That is why the net revenue growth in the numerator needs a churn view sitting next to it.
The third is lumpiness. One large annual contract can spike a quarter and push the magic number up, while a slow quarter drags it down, so a single reading on a business with big deals is noisy by nature. Smoothing with a trailing average or a full-year view steadies it.
The fourth is the lag assumption itself. The one-quarter delay between spend and revenue fits a fast sales cycle, but enterprise deals often take longer than a quarter to close, so the standard formula can understate efficiency for long-cycle businesses. The fix is to match the lag to your real sales cycle rather than defaulting to one quarter. Treat the magic number as one vital sign among several, not the whole diagnosis.
Key takeaways
- The magic number measures sales efficiency, capturing how much new annualized revenue each dollar of prior-quarter sales and marketing spend produced, expressed as a single ratio.
- The formula annualizes one quarter of revenue growth and divides by the prior quarter's spend, with the lag built in because spend in one quarter shows up as revenue in the next.
- 0.75 is the widely used floor, so above it a company is generally seen as ready to scale, below 0.5 the motion needs repair, and real private SaaS companies sit near a 0.68 median.
- Convert it to CAC payback with gross margin, since payback in months equals 12 divided by the magic number times gross margin, which exposes the delivery costs the ratio ignores.
- Use it as a throttle read on a trend, scaling spend when the number holds above 0.75 across several quarters and braking when it falls, rather than reacting to one reading.
- Pair it with margin, churn, and NRR, because the magic number credits all growth to spend and hides the mix, so it belongs next to context metrics before any decision.
TAGS

Written by
Daniel SemeckyCo-founder & CEO
Daniel is the co-founder and CEO of Glimpze. He spends his days talking to revenue teams about how to catch high-intent visitors before they bounce, and writes about inbound sales, lead conversion, and building a motion where marketing and sales actually share a number.


