
On this page
- What is onboarding completion rate?
- How do you calculate onboarding completion rate?
- Why does onboarding completion rate matter?
- What is a good onboarding completion rate benchmark?
- What is the difference between onboarding completion rate and activation rate?
- How do you increase onboarding completion rate?
- Key takeaways
- Sources
A product team ships a polished onboarding flow, watches signups climb, and assumes the funnel is healthy. Then someone charts the drop-off. Of every ten users who start the flow, four reach the end. The other six wander off somewhere in the middle, and most of them never open the product again.
Onboarding completion rate is the metric that catches that leak. It measures how many of the people who begin onboarding actually finish it, and it sits right on the path between a signup and a retained customer. A high rate means new users are getting to the setup they need to succeed. A low one means you are paying to acquire people who quit before the product ever has a chance to prove itself.
This guide covers what onboarding completion rate is, how to calculate it with a worked example, why it matters, what a good benchmark looks like, how it differs from activation rate, and the specific moves that push more users to the finish.
What is onboarding completion rate?
Onboarding completion rate is the percentage of users who finish your defined onboarding process out of everyone who starts it. It is a process metric that tells you whether the path you built to move a new user from signup to a working product actually gets walked.
Onboarding here means the guided sequence you set up to bring a new user to a usable state, whether that is a setup wizard, an interactive checklist, a product tour, or a run of empty-state prompts. Completion means the user reaches whatever you have marked as the end of that sequence, such as connecting a data source, inviting a teammate, or sending a first message.
The load-bearing word is "defined." The metric is only as honest as the finish line you draw. Mark three trivial clicks as onboarding and you will post a high completion rate that predicts nothing about whether users stay. Draw the finish line at a real setup milestone, the point where the product is configured enough to deliver its first result, and the number starts to track something that matters. Decide the finish line first, then measure against it.
Because it can be read step by step, completion rate is also diagnostic. A single blended number tells you how many users finish. The same metric broken out by step tells you exactly where they quit, which is the more useful view when you sit down to fix it.
How do you calculate onboarding completion rate?
You calculate onboarding completion rate by dividing the number of users who complete onboarding by the number who started it, then multiplying by 100. The formula is short, and the care is in defining the start and the finish.
Onboarding completion rate = (users who completed onboarding / users who started onboarding) x 100.
Here is a worked example. In a given month, 1,000 users begin your onboarding flow and 750 reach the end. Divide 750 by 1,000 to get 0.75, multiply by 100, and your completion rate is 75%, the same arithmetic KISSmetrics lays out in its onboarding completion rate glossary.
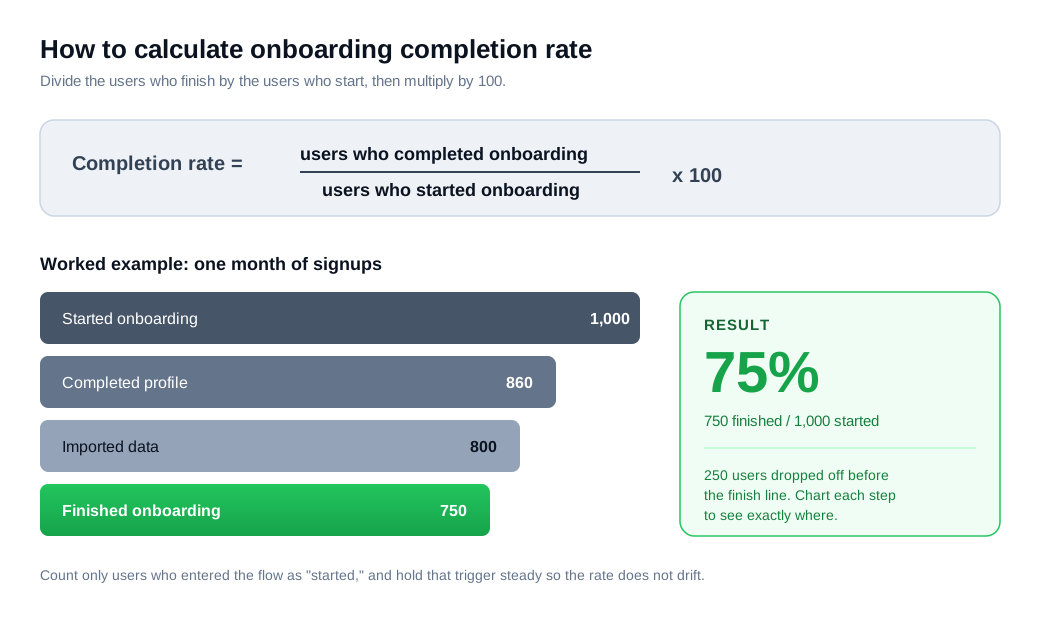
The denominator is where teams disagree with themselves. "Started onboarding" needs a single, consistent trigger: the moment a user enters the flow rather than the moment they sign up, since some signups never launch the flow at all. Pick one event and hold it steady, or the rate will drift for reasons that have nothing to do with the experience.
Two habits make the number trustworthy. Track it by cohort, grouping users by the week they signed up and following that fixed group forward, so a change you ship last month is measurable instead of smeared across time. And calculate completion at each step, rather than only end to end, so charting drop-off shows the exact point where users abandon rather than leaving you to guess.
Why does onboarding completion rate matter?
Onboarding completion rate matters because the users who finish onboarding are the ones most likely to stay, and the ones who quit early rarely come back. The metric works as an early, cheap proxy for retention that you can read weeks before a renewal or a second purchase.
The sentiment data is blunt. Wyzowl's onboarding research reports that 86% of customers say they are more likely to stay loyal to a business that offers helpful, welcoming onboarding content, and that 74% will switch to a competitor when onboarding feels too complicated. A user who abandons your flow halfway is telling you, in the moment, that the experience crossed that complexity line.
The economics make it hard to ignore. You have already spent the marketing money to bring a user to signup. If they quit onboarding before the product does anything useful, that spend is gone, and completion rate is the earliest place in the funnel where you can catch the loss and act on it. Every point of completion you recover is a user you already paid for, kept.
There is a diagnostic payoff too. A low completion rate rarely points to a bad product. Far more often it points to friction in a specific, findable place on the road to using it, which turns a vague retention worry into a concrete fix you can ship.
What is a good onboarding completion rate benchmark?
A good onboarding completion rate depends heavily on what you count as complete, but healthy full-flow onboarding generally lands in the 60 to 85 percent range, while long multi-step checklists run far lower. Read any benchmark against your own definition before you judge your number against it.
For a focused onboarding flow, the required steps that get a user to a working state, Appcues puts healthy SaaS completion at roughly 60 to 85 percent. Fall below that band and you have systematic friction worth hunting down.
Optional, longer checklists tell a different story. Userpilot's 2024 benchmark report, drawn from 188 SaaS companies across seven industries, put the average onboarding checklist completion rate at just 19.2%, with a median of 10.1%. The spread inside that average is wide: FinTech and Insurance products completed highest at 24.5%, Martech lowest at 12.5%, and sales-led companies edged product-led ones, 22.1% to 19%. The smallest companies, in the $1 to $5 million revenue band, completed highest of all at 27.5%.
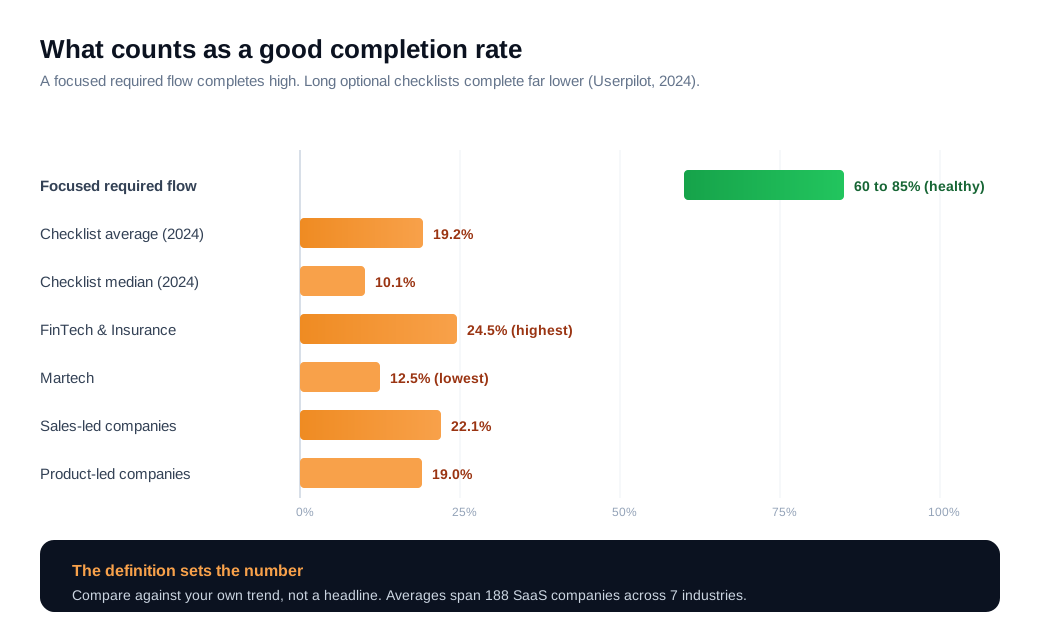
The gap between 85 percent and 19 percent looks like a contradiction, but it comes down to the difference between a short required flow and a sprawling optional checklist. That is exactly why the finish line you draw decides everything. The most useful benchmark is your own trend line: pick a stable definition, segment by cohort and channel, and watch whether the number climbs.
What is the difference between onboarding completion rate and activation rate?
Onboarding completion rate measures whether users finish the steps you laid out, while activation rate measures whether they reach real value, and a user can hit one without the other. Completion is a process metric. Activation is an outcome metric.
The distinction is practical. Completion asks whether the user walked the path you built. Activation asks whether the user got the win that predicts they will stay. Appcues treats activation as the single most important onboarding metric because it is the leading indicator of downstream retention, with most teams targeting 60 to 80 percent activation inside the first 30 days.
The dangerous pattern is high completion paired with low activation. When users finish your steps but still do not reach value, the flow is well-built and pointed at the wrong destination. That mismatch is the clearest sign that your defined finish line sits before the value moment, and it should be moved to land on it. When completion is defined well, it moves in step with activation, and the process metric becomes a fast, early read on the outcome you actually care about.
How do you increase onboarding completion rate?
You increase onboarding completion rate by cutting the steps that do not lead to value, showing users their progress, and stepping in the moment someone stalls. Work the drop-off chart from the biggest leak down.
Start by removing friction. Every step is another chance to quit, so pull optional fields out of required flows, defer advanced configuration until after the first win, and shorten the path to the shortest sequence that still leaves the product usable. Chameleon's work on onboarding drop-off points to charting completion at each step and attacking the highest-drop-off point first, since that is where the same effort recovers the most users.
Then show progress, because visible progress is a real motivator. The cleanest evidence comes from a car wash. In Nunes and Dreze's 2006 study of the endowed progress effect, customers given a loyalty card that needed eight stamps completed it at 19%, while customers given a card that needed ten stamps but arrived with two already filled completed it at 34%, nearly double the completion from identical real effort. A progress bar and a checklist tap the same drive, and marking the first step done before the user lifts a finger hands them a head start that pulls them toward the end.
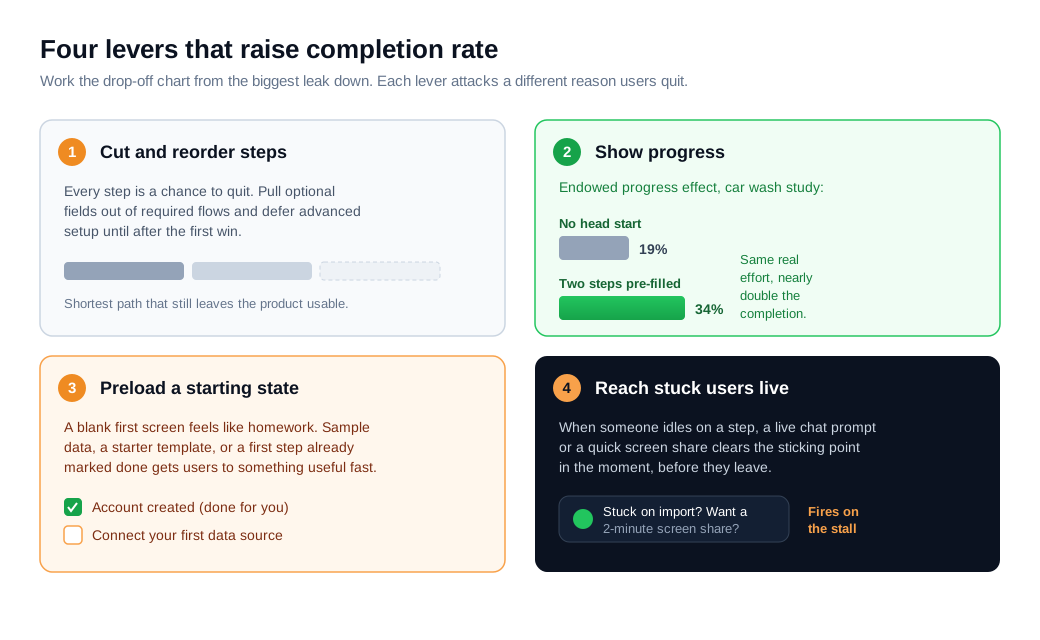
Finally, meet users where they stall. The drop-off chart tells you which step loses people, and the fix is to reach them at that exact step before they leave. A welcome message flow can greet each new account and point it at the right first action, so users never face a blank screen. When someone sits stuck on a step, a live chat prompt or a quick screen share clears the sticking point in the moment, and a proactive nudge that fires on the stall itself reaches the user while they still care, instead of a day later in an email they will not open.
Put numbers on it. A product signs 1,000 new users a month and 400 finish onboarding, a 40% completion rate. The team charts step-level drop-off and finds two-thirds of the loss lands on one data-import step buried behind three optional profile fields. They cut the optional fields, add a progress bar that starts with the first step already marked done, and trigger a live chat prompt when a user idles on the import step for sixty seconds. Completion climbs from 40% to 58%. That is 180 additional users a month reaching a configured product, from the same 1,000 signups and no extra acquisition spend. Because finished users go on to activate and retain at far higher rates than the ones who quit, those recovered 18 points feed straight into every downstream number. The figures are illustrative, but the method holds: find the biggest leak, remove its friction, show progress, and catch the stall in real time.
Key takeaways
- Onboarding completion rate is the share of starters who finish. It is a process metric for the guided path from signup to a working product, and it is only as meaningful as the finish line you define.
- The formula is completions over starts, times 100. Hold the start trigger steady, track by cohort, and calculate completion at each step so you can see exactly where users drop off.
- It matters because finishing predicts retention. Users who abandon rarely return, 74% will switch when onboarding feels too complicated, and completion is the earliest place to catch a leak you already paid to fill.
- A good benchmark depends on your definition. Focused flows run healthy at 60 to 85 percent, while Userpilot's 2024 data put average checklist completion at 19.2 percent, so compare against your own trend, not a headline.
- Completion and activation answer different questions. Completion asks whether users finished your steps, activation asks whether they reached value, and high completion with low activation means the finish line sits too early.
- You raise it by cutting steps, showing progress, and catching stalls. In the worked example, those three moves lifted completion from 40 to 58 percent, recovering 180 users a month with no extra acquisition spend.

Written by
Nilas MylerCo-founder & CTO, Glimpze
Nilas is the co-founder and CTO of Glimpze, an inbound sales tool that turns high-intent website visitors into live conversations. A former SEO consultant for some of the largest companies in Denmark, he writes about speed-to-lead, inbound sales, and conversion rate optimization — the technical and operational mechanics of turning traffic into pipeline.


