
On this page
- What is pipeline inspection in RevOps?
- How is pipeline inspection different from a pipeline review or forecast?
- What signals reveal deal health?
- How do you run inspection reviews?
- What metrics should RevOps track during inspection?
- How do you improve forecast accuracy with pipeline inspection?
- What are the common pipeline inspection mistakes?
- Key takeaways
- Sources
Every quarter ends the same way for teams that skip this work. A number that looked safe in week two turns soft in week eleven, two committed deals slip to next quarter, and the forecast the CRO defended to the board misses by double digits. Nobody lied along the way. The pipeline simply was not what the dashboard claimed it was.
Pipeline inspection is the discipline that closes that gap. It swaps optimistic status updates for evidence, which lets you find the soft deals in week two instead of week eleven, when there is still time to do something about them.
This guide covers what pipeline inspection is, how it differs from a pipeline review, the signals that reveal deal health, how to run an inspection cadence, the metrics RevOps should track, how the practice tightens forecast accuracy, and the mistakes that quietly undo it.
What is pipeline inspection in RevOps?
Pipeline inspection is the systematic review of every open opportunity against objective criteria to judge risk, validate deal quality, and decide what action each deal needs before it reaches the forecast. It is a repeatable process, run on a schedule, that treats each deal as a claim to be verified rather than a status to be reported.
The word inspection carries the weight here. A rep who says a deal is looking good is offering an opinion. Inspection asks for the facts behind that opinion: when the buyer last moved, who else is involved, what the agreed next step is, and whether the close date has held. RevOps owns the framework because the goal is one consistent standard across every rep and every deal, so a "commit" means the same thing on every team.
Salesforce shipped a productized version called Pipeline Inspection that gives managers a single view of open deals with stage history, close-date changes, deal movement, and forecast category in one place. Vendors like Outreach, Clari, and others sell similar revenue-intelligence layers. The tooling helps, but the practice does not depend on any one product. A disciplined team can inspect a pipeline in a spreadsheet as long as the criteria are objective and applied the same way every week.
Done well, inspection runs continuously instead of as a scramble at quarter close. That shift is the whole point. Teams that inspect early catch a stalling deal while the buyer is still reachable. Teams that inspect late are writing the post-mortem.
How is pipeline inspection different from a pipeline review or forecast?
A forecast is a prediction, a pipeline review is a meeting, and pipeline inspection is the fact-checking that makes both trustworthy. The three get blended together, and that confusion is a big reason so many reviews turn into status readouts that change nothing.
A forecast rolls open deals into a single expected number for the period. It answers how much you will close. A pipeline review is the recurring conversation where managers and reps walk the deals. Inspection is the layer underneath both: the objective test each deal has to pass before it earns a place in the commit. Without inspection, a review becomes a reading of the CRM out loud, and a forecast becomes the sum of everyone's optimism.
Said plainly, inspection supplies the evidence, the review is where you act on it, and the forecast is the output you can finally trust because the deals behind it were checked.
What signals reveal deal health?
The strongest signals are observed behaviors rather than rep opinions: time in stage, a concrete buyer-owned next step, stakeholder coverage, the engagement trend, and close-date stability. Each one is visible in the data, and each one degrades before a deal is officially lost.
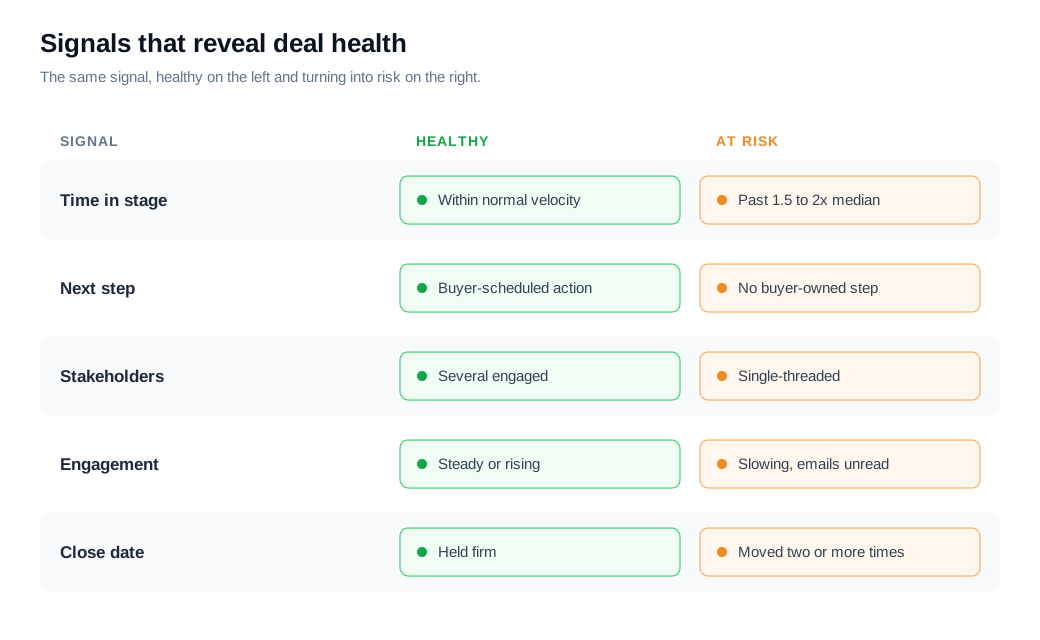
Time in stage is the clearest early warning. A deal that sits in one stage well past your normal velocity is stalling, whether or not the rep has admitted it. A common threshold is 1.5 to 2 times the median time deals spend in that stage. Cross it, and the deal gets flagged for a closer look.
A buyer-owned next step is the single best proxy for real momentum. Following up next week is a seller action. The buyer scheduling a security review for the 14th is a buyer commitment. Deals with no scheduled, buyer-side next step drift into no decision far more often than deals that have one.
Stakeholder coverage guards against single-threading. When an entire deal runs through one contact, a single job change or one internal veto can end it. Healthy deals in complex B2B sales show several engaged people across the buying group.
The engagement trend tells you which way things are moving. Replies slowing down, meetings getting rescheduled, and email going unread are all leading indicators, and they read cleaner than a verbal update because you observe them directly. Engagement captured in a real conversation is especially telling, since a buyer who takes a live chat or a call at the moment of interest is showing more intent than one who lets a form sit for a day. The earlier that conversation starts in an inbound sales motion, the more genuine engagement data the deal carries into every later inspection.
Close-date stability rounds it out. A close date that has moved twice has usually told you the truth already. Repeated slippage is one of the most reliable predictors that a committed deal will not commit.
The stakes are large. Research behind The JOLT Effect, drawn from an analysis of 2.5 million sales conversations, found that 40 to 60 percent of qualified deals are lost to no decision, and most of that loss traces to buyer indecision rather than a competitor win. Those deals rarely die loudly. They stall, then quietly expire, which is exactly the pattern health signals are built to catch.
How do you run inspection reviews?
Run inspection on a fixed cadence with a fixed structure so it becomes a habit instead of a fire drill. A common rhythm is a weekly one-on-one between manager and rep plus a biweekly team session, with a lighter daily glance at deals that changed. The cadence matters less than the consistency.
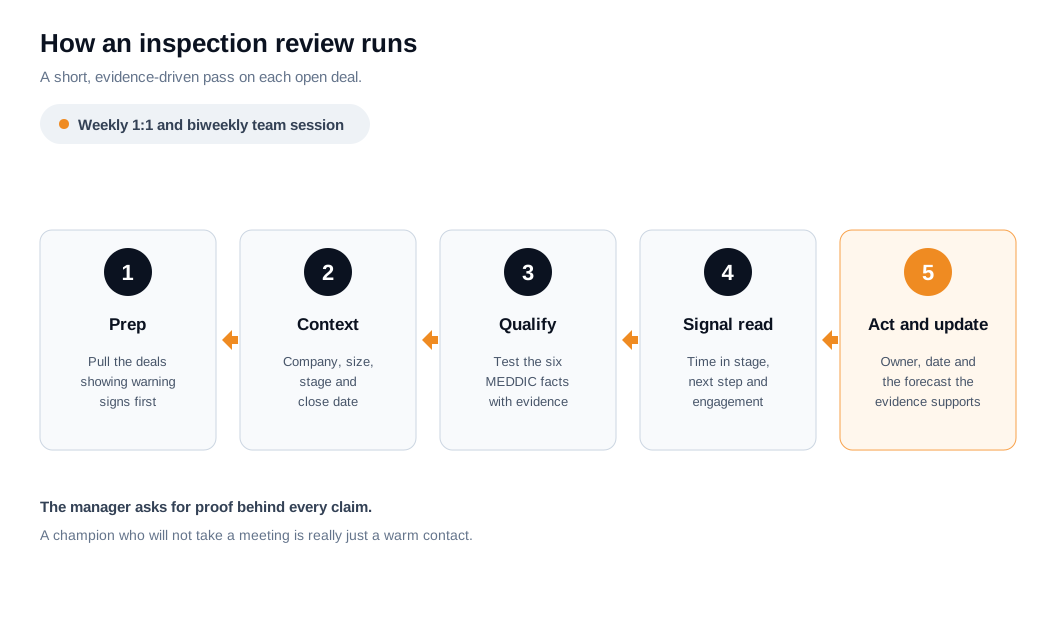
Structure each deal conversation so it stays short and evidence-driven. A workable pattern runs in five steps:
- Context in one minute: company, deal size, stage, and close date.
- Qualification check using a framework like MEDDIC, which tests six facts: Metrics, Economic buyer, Decision criteria, Decision process, Identify pain, and Champion.
- Signal read: time in stage, next step, stakeholders, engagement, and close-date history.
- Action: one specific next step with an owner and a date.
- Forecast update: move the deal into the category the evidence supports, even where that undercuts the rep's hope.
The manager's job is to ask for proof rather than accept a summary. When a rep names a champion, the useful follow-up is whether that champion actually holds influence over the economic buyer and has spent effort to advance the deal internally. A champion who will not take a meeting is really just a warm contact.
Prep is what separates a real inspection from theater. Before the meeting, RevOps or the manager pulls the deals showing warning signs, so the time goes to the risky ones instead of a rep reciting every deal in order. Wiring up alerts and routing so a flagged deal reaches the right person quickly keeps the process moving between meetings, which is where most of the recovery work actually happens.
What metrics should RevOps track during inspection?
Track a small set of metrics that measure pipeline quality rather than raw quantity: coverage ratio, slippage rate, stalled-deal rate, stage conversion, and average time in stage. Each answers a different question about whether the pipeline can carry the number.
Pipeline coverage ratio compares open pipeline to quota. The familiar 3x rule assumes a 33 percent win rate, since three dollars of pipeline at a one-in-three win rate returns roughly one dollar of bookings. It is a rough heuristic rather than a hard rule. A team winning 20 percent of loosely qualified deals may need 4x or 5x coverage to forecast reliably, while a team winning 40 percent on tightly qualified deals can hit its number at around 2.5x. Coverage built on inspected, qualified pipeline is worth far more than a big raw figure.
Slippage rate measures how much committed pipeline moves to a later period instead of closing on time. Strong teams keep slippage under 20 percent of committed pipeline. A rate that sits consistently above 30 percent usually points to a qualification or forecast-discipline problem rather than bad luck on individual deals.
Stalled-deal rate and average time in stage measure velocity, and stage conversion shows where deals leak out of the funnel. Read together, these tell RevOps whether the pipeline is healthy enough to inspect deal by deal or broken enough to need a process fix upstream. A pipeline with 3x coverage but a 35 percent slippage rate is not really covered at all.
How do you improve forecast accuracy with pipeline inspection?
Forecast accuracy improves when the committed number is built from inspected deals rather than rolled up from rep confidence. Inspection removes the deals that fail the evidence test before they inflate the forecast, so the number you report reflects what will actually close.
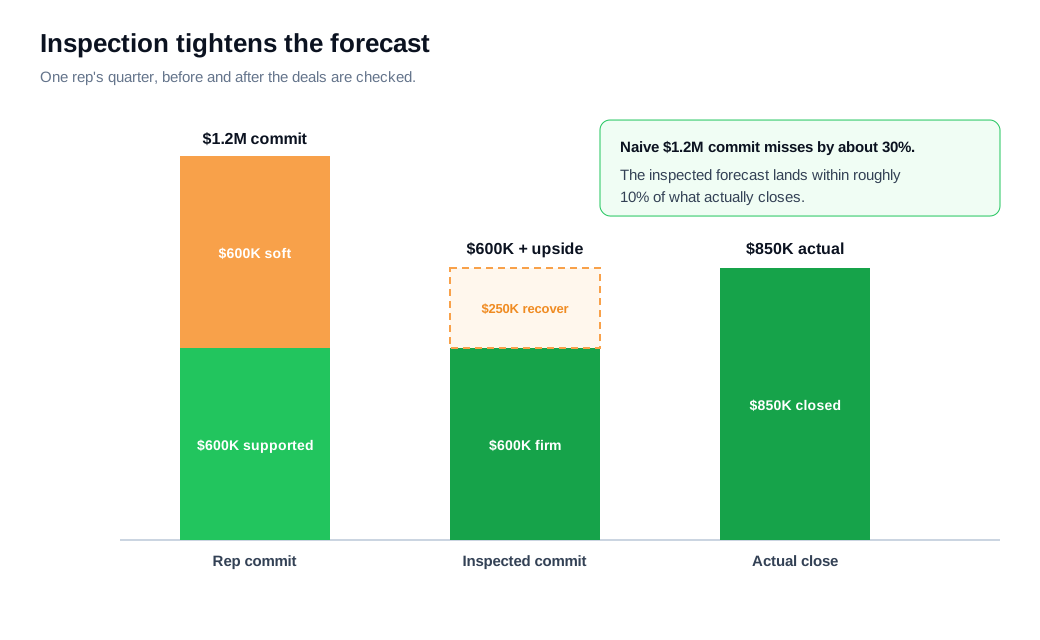
Here is a worked example. A rep carries a $1.2M commit for the quarter across eight deals. On inspection, three deals fail the test: one has sat in Proposal for six weeks with no buyer next step ($250K), one has moved its close date twice ($200K), and one is single-threaded through a contact who stopped replying ($150K). That is $600K of soft commit. You do not delete those deals, but you move them out of commit and assign a recovery action to each. The inspected commit becomes $600K of well-supported pipeline plus whatever the three at-risk deals recover. If two recover and one dies, the quarter lands near $850K. The naive $1.2M would have missed by roughly 30 percent, while the inspected forecast lands within about 10 percent.
That gap is the reason the practice exists. Gartner research reports that only 7 percent of sales teams forecast with better than 90 percent accuracy, that the median sits at 70 to 79 percent, and that 69 percent of sales operations leaders say forecasting is getting harder. Inspection attacks the root cause, which is that most forecasts are built on unverified deal data.
Two habits compound the benefit. First, feed inspection with clean activity and engagement data, since a health score is only as good as the signals under it. Second, close the loop: when an inspected deal closes or dies, compare the outcome to the call you made and tune your thresholds. Over a quarter or two, the pattern of late surprises fades and the weekly forecast starts to hold.
What are the common pipeline inspection mistakes?
The most common mistake is turning inspection into a status meeting where reps recite deals in order and nobody's forecast actually moves. If the review ends and every deal sits in the same category it started in, all you held was a reading of the CRM.
A few other traps show up again and again. Inspecting only at quarter end guarantees you find problems too late to fix them. Trusting the stage field over the buyer's behavior lets a deal parked at Proposal look healthy while the buyer has gone silent. Punishing reps for honest downgrades teaches them to sandbag, so the pipeline fills with quiet padding that inspection was supposed to remove. And running inspection on dirty data produces confident conclusions from missing activity, which is worse than admitting you do not know.
The fix for all of them is the same. Keep the cadence tight, judge deals on observed behavior, reward honesty over optimism, and invest in the underlying activity data before you invest in another scoring model.
Key takeaways
- Pipeline inspection verifies deals rather than just reporting them. RevOps applies objective criteria to every open opportunity so risk surfaces early enough to act on.
- Behavioral signals beat opinions. Time in stage, a buyer-owned next step, stakeholder coverage, the engagement trend, and close-date stability reveal deal health before a deal is formally lost.
- Cadence plus structure makes it stick. A weekly one-on-one and a biweekly team review, each running the same evidence checklist, turn inspection into a habit instead of a quarter-end scramble.
- Track quality over volume. Coverage ratio, slippage rate, stalled-deal rate, and time in stage tell you whether the pipeline can really carry the number.
- Inspected forecasts land closer. Building the commit from deals that pass the test is the most direct fix for the forecast-accuracy gap Gartner documents.
- The data underneath decides everything. Clean activity and engagement signals, captured as early as the first conversation, are what make inspection trustworthy.

Written by
Daniel SemeckyCo-founder & CEO
Daniel is the co-founder and CEO of Glimpze. He spends his days talking to revenue teams about how to catch high-intent visitors before they bounce, and writes about inbound sales, lead conversion, and building a motion where marketing and sales actually share a number.


