On this page
A visitor taps your link with intent. The page hangs on a white screen for a beat, then another, and before your headline finishes painting they have already hit back and moved to the next result. That decision took less time than reading this sentence, and no amount of persuasive copy ever got a chance to load.
Speed is one of the few conversion levers you can pull without changing the offer, the design, or the traffic mix. It is also measurable to the millisecond, which means the cost of a slow page is not a guess. You can put a dollar figure on it.
This post covers how load time changes conversions, what a slow site costs in revenue, what counts as a good load time, how to measure Core Web Vitals, how to speed up your pages, and whether any of it helps your search rankings.
How does page load time impact conversions?
Page load time and conversion rate move in opposite directions: as pages get slower, fewer visitors convert, and the sharpest damage lands in the first few seconds. The relationship is well documented, and it holds across industries and devices.
Portent analyzed just over 100 million page views across 20 B2B and B2C sites and found that conversion rate falls by an average of 4.4% for each additional second of load time between zero and five seconds. In the same dataset, a page that loads in one second converts about three times better than one that takes five seconds, and roughly five times better than one that takes ten. The first five seconds are where most of the money is won or lost.
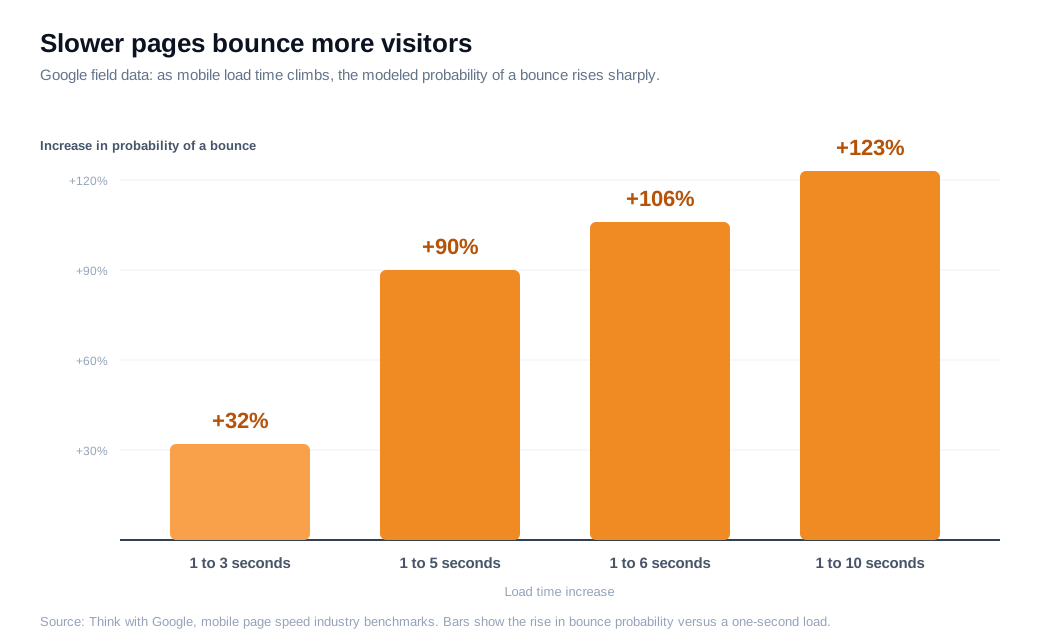
Google's field research shows the same pattern from the bounce side. According to Think with Google, 53% of mobile visits are abandoned if a page takes longer than three seconds to load, and the modeled probability of a bounce climbs 32% as load time goes from one to three seconds, 90% as it goes from one to five, and 123% as it stretches from one to ten. Every extra second is another chance for the visitor to give up before they engage.
Two things drive the loss. Some visitors bounce outright, leaving before the page is usable and never entering your funnel at all. The rest move slower, and every step after that (a product page, a cart, a form) reloads the same patience test, so a site that is sluggish everywhere leaks conversions at each stage rather than only at the front door.
What does a slow site actually cost in revenue?
A slow site costs revenue you can calculate, because a change in conversion rate applied to your traffic and order value turns milliseconds into a dollar figure. The math fits on a napkin, and the result usually surprises people.
Work an example. Say an online store gets 200,000 visits a month, converts at 2.5%, and has an average order value of $80. That is 5,000 orders and $400,000 in monthly revenue. The store currently paints its main content in about four seconds. Using Portent's finding that conversion drops roughly 4.4% for each second in the zero to five second range, cutting the load time to two seconds would lift conversion by around 9% in relative terms, from 2.5% to about 2.72%.
Run the same traffic through the faster site and you get 5,440 orders instead of 5,000, worth $435,200. That is an extra $35,200 a month, or more than $420,000 a year, from a two-second improvement and nothing else. No new ad spend, no redesign, no additional visitors.
Real brands report gains in the same shape. The Milliseconds Make Millions study, commissioned by Google and run by Deloitte across roughly 30 million mobile sessions, isolated speed as a variable and found that a 0.1-second improvement in mobile load time lifted retail conversions by 8.4% and average order value by 9.2%, while travel conversions rose 10.1%. A tenth of a second moved real money at scale. Your own number depends on your traffic, margins, and starting speed, so run the calculation with your figures before you decide how much a fix is worth.
What is a good page load time?
A good page load time gets your main content visible in under about 2.5 seconds, with three seconds the threshold where mobile abandonment starts climbing fast. That target lines up with both the old rule of thumb and the metric Google now uses to grade pages.
There are two ways to think about the number. The older heuristic counts total seconds to load and treats three seconds as the danger line, which is where Google's mobile research put the sharp rise in abandonment. The modern standard is more precise: it measures the moment the largest piece of content in the viewport actually appears, and calls anything under 2.5 seconds good. Aiming to paint meaningful content in roughly two seconds keeps you inside both.
Context still matters. Benchmark against your own industry and, above all, against mobile, because field data consistently shows phones loading slower than the desktop tests developers tend to run on fast office connections. A page that feels instant on your laptop can sit well past three seconds on a mid-range phone over cellular, and that is the experience most of your visitors actually get.
How do you measure Core Web Vitals?
You measure Core Web Vitals with two kinds of data: field data from real users, which is the version Google actually scores, and lab data from a controlled test you run on demand. Google's tools give you both, and the two do not always agree.
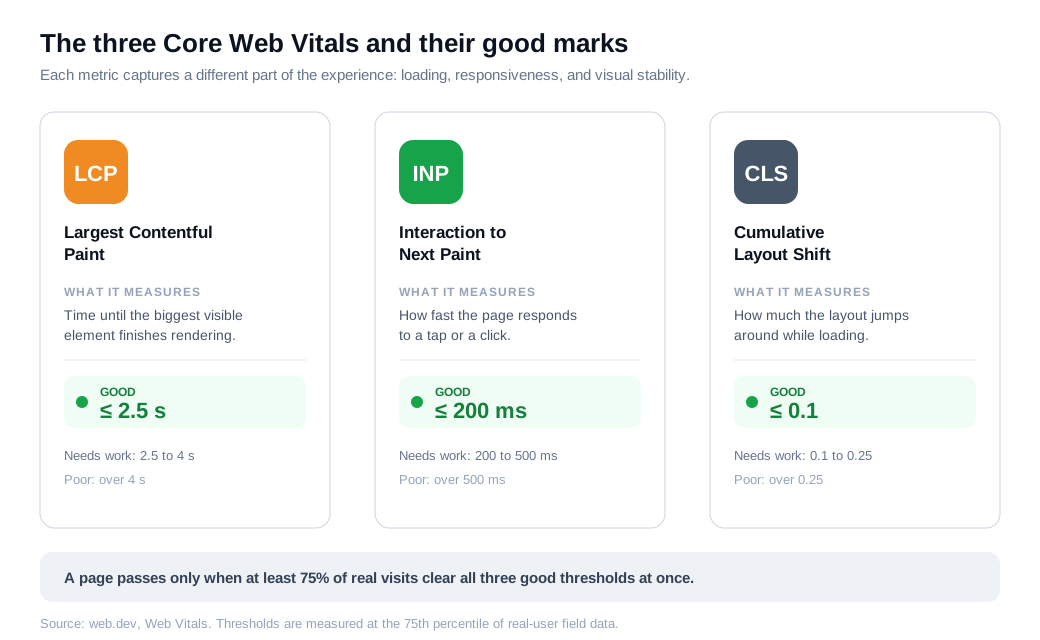
Core Web Vitals are three metrics, each with a published "good" threshold defined on web.dev. Largest Contentful Paint (LCP) measures how long until the biggest visible element renders, and good is under 2.5 seconds. Interaction to Next Paint (INP) measures how quickly the page responds to taps and clicks, and good is 200 milliseconds or less. Cumulative Layout Shift (CLS) measures how much the layout jumps around while loading, and good is 0.1 or lower. A page passes only when at least 75% of real visits clear all three thresholds at once.
Field data comes from the Chrome User Experience Report (CrUX), which collects real Chrome users' measurements over a rolling 28-day window. Lab data comes from Lighthouse, which loads the page once in a simulated environment. PageSpeed Insights shows both side by side: CrUX field numbers at the top for what your users experience, and a Lighthouse audit below with specific fixes. For ongoing monitoring, the Core Web Vitals report in Google Search Console tracks your whole site's field data, and the open-source web-vitals JavaScript library lets you record the same metrics inside your own analytics. Expect field and lab to diverge, since a lab test on a fast connection cannot see the slow phones and flaky networks in your real traffic.
How do you improve page speed?
You improve page speed by fixing the largest bottleneck first, which is usually the server response, the hero image, or render-blocking scripts, then trimming everything else that competes for the connection. Google's own LCP guidance stresses that speed rarely comes from one quick fix, so you work the whole loading path rather than a single setting.
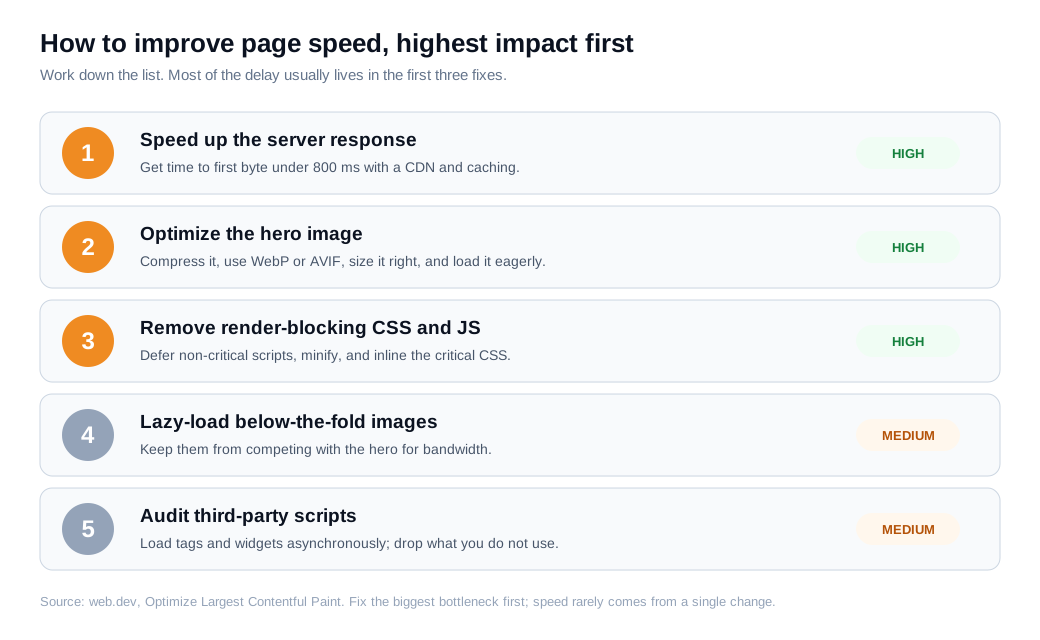
Start with the server. A slow time to first byte, generally anything over 800 milliseconds, delays everything after it, and a content delivery network plus proper caching is the usual remedy. Then handle the hero image, which is the largest element on most pages. Compress it, serve it in a modern format like WebP or AVIF, size it to the space it fills, and load it eagerly rather than lazily. Google's Flights team added a single fetchpriority="high" attribute to their hero image and cut LCP by 700 milliseconds, the biggest win in their whole performance sprint.
Next, clear the render-blocking resources. CSS and JavaScript that the browser must download and process before it can paint will hold up your content, so defer non-critical scripts, minify what remains, and inline the small amount of CSS needed for the first screen. Lazy-load images below the fold so they do not compete with the hero for bandwidth.
Then watch your third-party tags, because analytics, ad pixels, and widgets each add weight. A live chat box, a heat-map script, and a testimonial widget can quietly cost you a second between them, so favor tools that load asynchronously and audit the ones that do not. When you add a chat or support widget, the single lightweight snippet described in the widget install guide loads after your content, which keeps it from blocking the first paint.
Does page speed affect SEO and search rankings?
Yes, page speed affects SEO, because Core Web Vitals are a confirmed Google ranking signal, though a modest one that mainly acts as a tiebreaker between pages of similar relevance. Speed will not rescue thin content, and it will not outrank a far more relevant result, but between two close competitors the faster page has an edge.
There is an indirect effect too. A slow page that visitors abandon sends weak engagement signals and wastes crawl budget, both of which can drag on rankings over time. Because Google indexes the mobile version of your site first, the mobile speed your field data reports is the speed that counts for search, not the fast desktop numbers you might see in a lab test.
The two effects point the same way, which is what makes speed worth the engineering time. A faster page ranks a little better, so more people arrive, and it converts a higher share of them once they do. For an inbound sales team that depends on website traffic, that means the high-intent visitor who searched for exactly what you sell actually reaches your page and your conversation, instead of bouncing to a competitor while your hero image is still loading.
Page speed and conversion FAQs
Does page speed matter more on mobile than desktop?
It matters on both, but the stakes are higher on mobile, where connections are slower, hardware is weaker, and Google indexes the mobile version of your site first. Field data routinely shows phones loading a page one to several seconds slower than a desktop test on office wifi, so a page that passes on your laptop can fail for the majority of real visitors. Test on a throttled mobile connection rather than relying on your own machine.
Is a faster server or a lighter page more important?
Fix whichever one your measurements say is worse, since both feed the same metric. A slow time to first byte delays the start of everything, so no amount of front-end trimming will help until the server responds quickly. Once the server is fast, page weight and render-blocking scripts become the limiting factor. PageSpeed Insights and a waterfall view will tell you which half of the problem is costing you the most.
How often should you check Core Web Vitals?
Check field data monthly as a baseline, and run a lab test whenever you ship a change that could affect load time, such as a new template, a hero image, or a third-party script. Because CrUX field data covers a rolling 28-day window, a regression can take a few weeks to show up fully in the numbers Google scores, so pair the slow field signal with fast lab tests on your key templates to catch problems before they spread.
Key takeaways
- Speed and conversion move in opposite directions. Portent found conversion drops about 4.4% for every second in the first five, and a one-second page converts roughly three times better than a five-second one.
- The cost is calculable. Apply a realistic conversion lift to your traffic and order value, and a two-second improvement can be worth six figures a year with no extra spend.
- Aim for content in under 2.5 seconds. That target satisfies both the old three-second mobile abandonment line and the Core Web Vitals LCP threshold Google grades against.
- Measure with field data first. Real-user CrUX numbers are what Google scores and what your visitors feel, so trust them over lab tests when the two disagree.
- Fix the biggest bottleneck first. Server response, the hero image, and render-blocking scripts cause most of the delay, and a single fetchpriority attribute cut LCP by 700 milliseconds for Google Flights.
- Speed helps rankings and conversions together. Core Web Vitals are a real, if modest, ranking factor, and a faster page both attracts and converts more of the traffic it earns.
TAGS

Written by
Nilas MylerCo-founder & CTO, Glimpze
Nilas is the co-founder and CTO of Glimpze, an inbound sales tool that turns high-intent website visitors into live conversations. A former SEO consultant for some of the largest companies in Denmark, he writes about speed-to-lead, inbound sales, and conversion rate optimization — the technical and operational mechanics of turning traffic into pipeline.