
On this page
Someone searches for a problem you solve, clicks your result, reads the top of the page for six seconds, and leaves. Your analytics files that as a bounce. Multiply it by a few thousand visits and you have a number on a dashboard that people either ignore or panic about, usually with no idea which reaction is correct.
Bounce rate is one of the most quoted and most misunderstood metrics in web analytics. A high number can mean your page is broken, or it can mean the page answered the question so well that nobody needed a second click. This post covers how bounce rate is calculated, what a normal rate looks like for your kind of page, how it differs from exit rate, why yours might be high, whether it affects SEO, and the changes that actually bring it down.
What is bounce rate?
Bounce rate is the percentage of visits to your site that end on the same page where they started, with no further interaction. A visitor lands, does not click through to a second page or trigger a tracked action, and leaves. That single-page visit is a bounce.
The metric was designed as a rough proxy for engagement. If most people who arrive on a page leave immediately, something about that first impression is not working, whether that is the load speed, the message, the design, or the match between what the visitor expected and what they found.
One important shift happened in 2023. Google retired Universal Analytics and moved everyone to Google Analytics 4, which redefined the metric. In the old model, a bounce was strictly a single-page session with no second hit. In GA4, bounce rate is the inverse of engagement rate, so the definition now depends on whether a session was engaged, not only on whether a second page loaded. That change matters enough that it deserves its own look at the math.
How is bounce rate calculated?
Bounce rate is calculated by dividing single-page sessions by total sessions, then multiplying by 100. If 4,000 sessions land on your pricing page in a month and 1,600 of them leave without a second action, your bounce rate is 1,600 divided by 4,000, times 100, which is 40 percent.
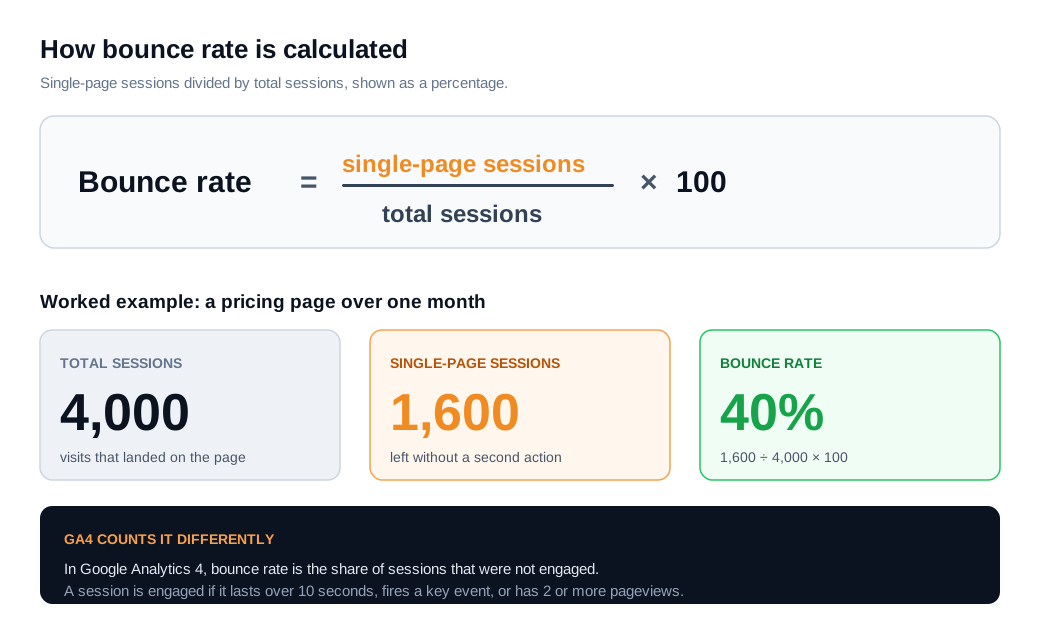
That formula is simple. What counts as a bounce is where the tools disagree.
Universal Analytics counted a bounce whenever a session had exactly one pageview and no other interaction event. Time on the page was effectively zero because there was no second event to measure duration against, so a visitor could read for four minutes, close the tab, and still register as a bounce.
GA4 flipped the logic. It measures engaged sessions first, then treats everything else as a bounce. A session is counted as engaged if it meets at least one of three conditions: it lasts longer than 10 seconds, it fires a key event (what GA4 calls a conversion), or it includes two or more pageviews or screenviews. Bounce rate is then whatever share of sessions did not clear that bar, which is why engagement rate and bounce rate always add up to 100 percent. The 10-second threshold is a default you can raise to as high as 60 seconds per data stream.
The practical effect is that GA4 bounce rates usually look lower than the old Universal Analytics numbers for the same page, because a visitor who stays 15 seconds now counts as engaged even on a single page. If you are comparing today's figure to a screenshot from 2022, you are comparing two different metrics. Note the definition your tool uses before you read anything into the number.
What is a good bounce rate?
A good bounce rate depends entirely on the job of the page, but as a rough anchor, most sites land somewhere between 41 and 55 percent overall, and anything under 40 percent is strong for a page built to drive a next step. There is no single target that applies to every page on every site.
Intent is the variable that swamps everything else. A blog post that fully answers a question will bounce high because the reader got what they came for and left satisfied. A checkout flow that bounces high has a real problem. Judging both against the same benchmark would tell you nothing useful.
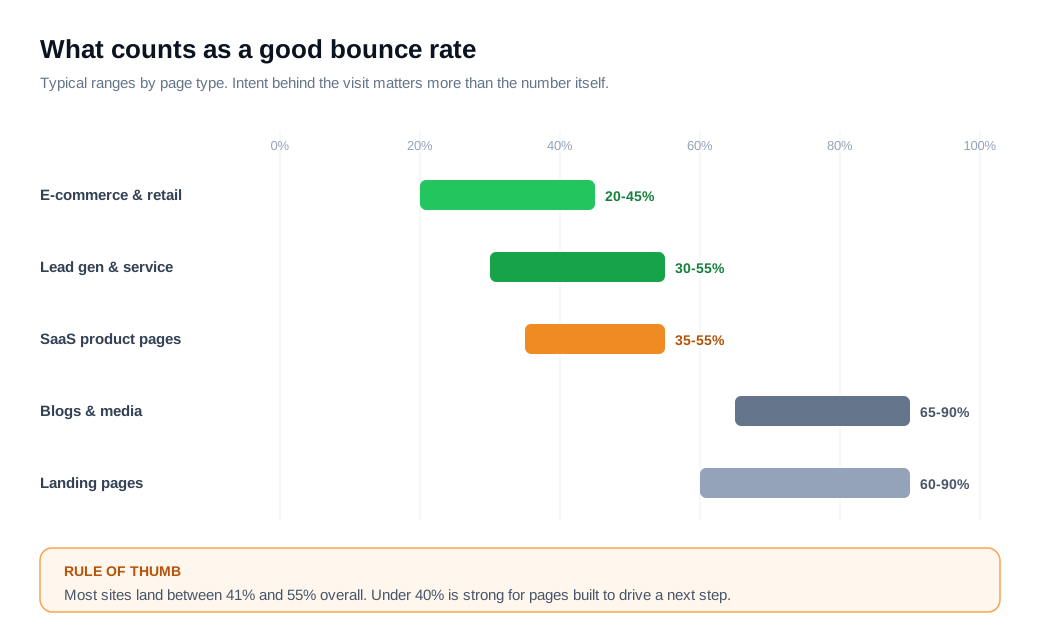
Rough ranges by page type look like this. E-commerce and retail pages tend to sit lowest, around 20 to 45 percent, because visitors are actively browsing and clicking between products. Lead-generation and service pages run about 30 to 55 percent. SaaS product pages fall in a similar band. Blogs, media, and reference content run high, often 65 to 90 percent, because single-page satisfaction is the norm. Single-purpose landing pages also run 60 to 90 percent, since they are built to produce one action or none.
Channel changes the picture as much as page type. Contentsquare's 2024 benchmark, drawn from more than 43 billion sessions across roughly 3,590 sites, found that visits from social bounce about 41 percent more often than visits from paid search, because social traffic is browsing casually while paid-search traffic arrived with a specific query. Before you compare your rate to any benchmark, segment it by source. A blended, whole-site number averages together audiences that behave nothing alike.
Bounce rate vs. exit rate: what's the difference?
Bounce rate and exit rate both measure people leaving, but they count different things. A bounce is a visit where the entry page is also the only page. An exit is simply the last page of a visit, no matter how many pages came before it.
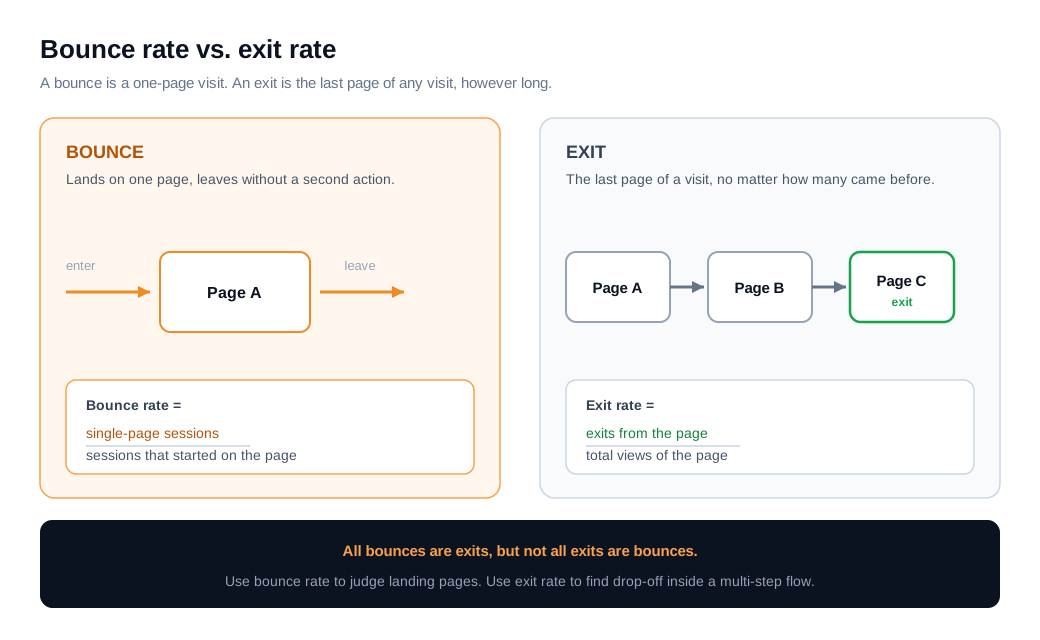
Here is the relationship in one line: all bounces are exits, but not all exits are bounces. Bounce rate for a page uses only the sessions that started there. Exit rate for a page uses every view of that page and asks how often it was the last one in the session, regardless of what the visitor did before.
A worked example makes the split clear. Say your checkout page is viewed 1,000 times in a month and is the last page in 300 of those sessions. That is a 30 percent exit rate. Almost none of those are bounces, because people rarely start a session on a checkout page; they arrived from a product page or a cart. The exit rate is the number that matters here, and a 30 percent exit at the payment step is a leak worth investigating.
The rule of thumb: use bounce rate to judge pages where visitors land first, like blog posts, ad landing pages, and organic entry points. Use exit rate to find drop-off points inside a multi-step flow, like a checkout or a signup sequence. A high bounce on a page that thoroughly answers a search query can be a sign of success. A high exit rate on step two of your checkout is almost never good news.
Why is my bounce rate high?
Your bounce rate is high when the page fails to deliver on the expectation that brought the visitor there, and slow load speed is the single most common culprit. People decide whether to stay within the first few seconds, and a page that is still assembling itself loses them before it says anything.
The speed numbers are stark. Google's mobile research found that as page load time goes from 1 second to 3 seconds, the probability of a bounce increases 32 percent. At 5 seconds the bounce probability is up 90 percent, and at 10 seconds it is up 123 percent. Separately, Google has reported that 53 percent of mobile visits are abandoned if a page takes longer than 3 seconds to load. Speed is the floor everything else stands on.
After speed, the usual causes cluster into a few groups, most of them documented in analyses like Search Engine Journal's rundown of high-bounce reasons:
- Mismatched intent. The title or meta description promised one thing and the page delivered another, so visitors leave the moment they realize it. This is common on pages that rank for or bid on keywords that do not match the content.
- Poor mobile experience. Tap targets are too small, text needs pinching to read, or a popup covers the screen on a phone. Mobile is where most traffic lives, so a weak mobile layout drags the whole number up.
- Weak or buried content. A wall of text with no headings, no formatting, and no clear answer near the top makes people bail before they scroll.
- Technical breakage. Broken links, a form that will not submit, an error, or an intrusive interstitial all push people back to the search results.
- No obvious next step. If nothing on the page invites a click, and the visitor has finished reading, leaving is the only option you have given them.
A high number is a symptom, not a diagnosis. The way to find the actual cause is to segment. Split bounce rate by device, by traffic source, and by landing page, and the outliers usually point straight at the problem. A rate that is fine on desktop and terrible on mobile is a layout issue. A rate that spikes for one ad campaign is a message-match issue on that campaign's page.
Does bounce rate affect SEO rankings?
No, bounce rate is not a Google ranking factor, and it never has been as a direct signal. Google does not have reliable access to the metric in the first place, since it depends on analytics code that Google does not control and that many sites do not run.
Google representatives have said this plainly for years. John Mueller of Google addressed the misconception directly, noting that the idea Google looks at analytics bounce rate for ranking is not the case. The metric can also be gamed trivially by firing a fake event on page load, which is another reason a search engine would not lean on it.
That said, bounce rate is still worth watching, because the things that cause a high bounce, slow pages, thin content, and a poor mobile experience, are the same things that hurt rankings and conversions through other, more direct paths. Treat bounce rate as a diagnostic that points you toward real problems, not as a score you are being graded on.
How do you lower bounce rate?
You lower bounce rate by fixing the reasons people leave, starting with speed and message match, then giving anyone who stays an obvious reason to keep going. The order matters, because a fast page with the wrong message still bounces, and a well-matched page nobody can load never gets the chance.
Work through these in roughly this order:
- Make the page load fast. Compress and correctly size images, minify CSS and JavaScript, and serve assets through a CDN. Aim for under 2 seconds. This is usually the highest-return fix because it affects every visit.
- Match the page to the promise. The headline should confirm, within the first line, that the visitor is in the right place for the query, ad, or link they clicked. Rewrite titles and meta descriptions that oversell.
- Fix the above-the-fold moment. Lead with the answer or the value, use clear headings, break up long paragraphs, and make the primary content visible without scrolling or dismissing a popup.
- Add relevant internal links and a clear next step. Point readers to the logical follow-on page and use specific calls to action instead of generic "click here" buttons. One good next step beats five competing ones.
- Repair the mobile experience. Test on a real phone. Check tap target size, font legibility, and any interstitials that Google and users both penalize.
There is one more lever that most guides skip, and it applies mainly to high-intent pages like pricing, product, and demo pages: give a hesitating visitor a way to get an answer without leaving. A large share of bounces on those pages are people with a real question and no fast way to ask it, so they open a competitor's tab instead. Offering live chat at the moment interest peaks catches some of that group before they go, and for a B2B inbound sales motion it turns a would-be bounce into a conversation while the buyer is still on the page. You can go further with proactive outreach nudges that trigger when someone lingers on a key page, though the same caution applies as with any popup: a nudge that interrupts too early does more harm than the bounce it was meant to prevent.
Whatever you change, measure the segment, not the sitewide average. Pick the pages with the most traffic and the clearest job, fix one cause at a time, and watch bounce rate for that page and that source together. Chasing a single blended number across the whole site tells you almost nothing about what to do next.
Key takeaways
- Bounce rate is single-page sessions divided by total sessions, but GA4 redefined it as the inverse of engagement rate, so a session that lasts over 10 seconds now counts as engaged even on one page.
- There is no universal good bounce rate. Most sites average 41 to 55 percent, e-commerce runs lower, and content pages run 65 to 90 percent because a satisfied one-page visit is normal.
- Bounce rate and exit rate are not interchangeable. All bounces are exits, but exit rate covers every visit's last page, which makes it the better metric for multi-step flows like checkout.
- Speed is the biggest driver of high bounce. Bounce probability rises 32 percent as load time goes from 1 to 3 seconds, and 53 percent of mobile visits are abandoned past the 3-second mark.
- Bounce rate is not a Google ranking factor, but its common causes, slow pages and thin or mismatched content, do hurt rankings and conversions through other paths.
- Fix causes, not the number. Improve speed and message match first, then add clear next steps, and always analyze bounce rate by page and traffic source rather than sitewide.
TAGS

Written by
Nilas MylerCo-founder & CTO, Glimpze
Nilas is the co-founder and CTO of Glimpze, an inbound sales tool that turns high-intent website visitors into live conversations. A former SEO consultant for some of the largest companies in Denmark, he writes about speed-to-lead, inbound sales, and conversion rate optimization — the technical and operational mechanics of turning traffic into pipeline.


