
On this page
A product team can win the signup and still lose the customer. New accounts climb, the dashboard looks healthy, and a large share of those users open the product once, click around for a few minutes, and never return to the thing they actually paid for. Adoption is the quiet step between signing up and using a product for real, and it decides whether every other number in the funnel means anything.
None of this is luck. Pendo studied feature usage across hundreds of software products and found that about 80 percent of features are rarely or never used, which means most products carry a warehouse of capability that no one has adopted. The upside is that adoption responds to a short, repeatable list of moves, and you can measure whether they are working.
This post covers what product adoption is, the stages a user moves through, how to measure it, what a good adoption rate looks like, the tactics that move the number, and how adoption compounds into retention and revenue.
What is product adoption?
Product adoption is the process by which a new user goes from first exposure to a product to using it regularly, as a genuine part of their workflow, to get the value they signed up for. It is a journey with a start and an end rather than a single click, and most users who abandon a product do so because they never finish that journey.
It helps to separate two words that often get mixed up. Activation is a single early milestone, the first moment a user reaches real value, sometimes called the aha moment. Adoption is the sustained state that follows, where the user returns to the core features again and again because the product has earned a place in how they work. A user can activate and still never adopt, which is exactly the gap most teams underestimate.
Zoom out to the whole market and adoption follows a predictable shape. Everett Rogers described five groups who take on a new product at different speeds, from innovators at roughly 2.5 percent and early adopters at 13.5 percent, through an early and late majority of about 34 percent each, to laggards at 16 percent, as Appcues lays out in its breakdown of the product adoption curve. Geoffrey Moore later named the hardest part of that curve the chasm, the gap between the early adopters who tolerate rough edges and the pragmatic majority who will not. At the account level the same logic plays out inside your user base, where a handful of power users adopt fast and the rest need a clear reason to follow.
One more distinction matters for measurement. Optimizely draws a line between feature trial, a one-time use, and feature adoption, repeated and sustained engagement, and warns that most products see a steep drop between the two. Counting a single click as adoption flatters the number and hides the leak.
What are the stages of the product adoption process?
Product adoption unfolds in stages, and a user can fall out at any one of them, so it helps to picture the journey as a funnel that narrows from broad awareness down to habitual use. A clean version has five steps: awareness, sign-up, activation, adoption, and expansion.
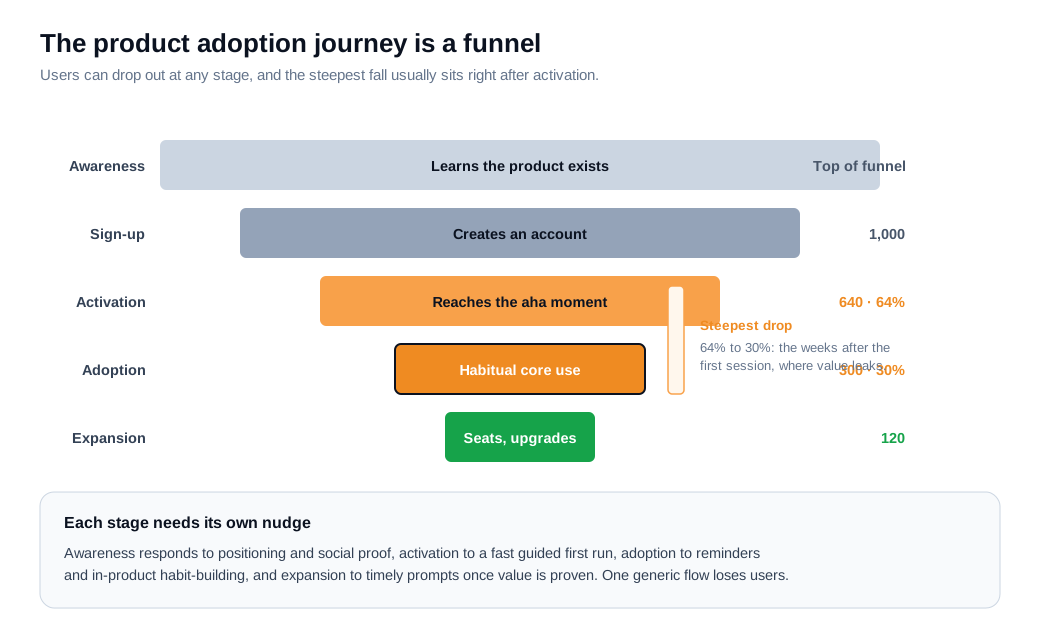
Awareness and sign-up sit at the top of the funnel, where a user learns the product exists and decides it is worth a try. Activation is the pivot, the first session where the user reaches the aha moment and sees why the product matters. Adoption is the stretch that follows, where that first taste turns into a repeated habit around the core features. Expansion is the reward, where an adopted user pulls in teammates, upgrades, or leans on more of the product.
The drop between stages is where value leaks, and it is usually severe. Optimizely offers a blunt illustration: a product where 1,000 users sign up, 900 complete activation, and only 70 become regular adopters of the core functionality. The cliff there sits between activation and sustained use rather than between signup and activation, and that later stage is the one teams tend to neglect once the flashy onboarding tour is done.
Each stage needs a different nudge. Awareness responds to positioning and social proof, activation to a fast and guided first run, adoption to reminders and in-product habit-building, and expansion to timely prompts once value is proven. Treating the whole thing as one generic onboarding flow is why so many products lose users right after the first session.
How do you measure product adoption?
You measure product adoption by defining the one core action that signals real value, then tracking the share of new users who reach it and keep returning to it over a set window. The base metric is the adoption rate, and the formula is simple: the number of users who meet your definition of active, divided by the total number of new users in the same period, times 100, as Wall Street Prep sets out in its calculation example.
The trick is the definition of active. An adoption rate is only as honest as the action behind it, so pick the core feature that maps to the value proposition and measure sustained use of it over 30, 60, or 90 days, not a single visit. A few other metrics fill in the picture:
- Activation rate: the share of signups who reach the first-value milestone.
- Feature adoption rate: the share of users who use a specific feature, so you can see which parts of the product actually land.
- Time to value: how long it takes a new user to reach that first aha moment, where shorter is almost always better.
- DAU/MAU stickiness: daily active users divided by monthly active users, a quick read on how habitual usage has become.
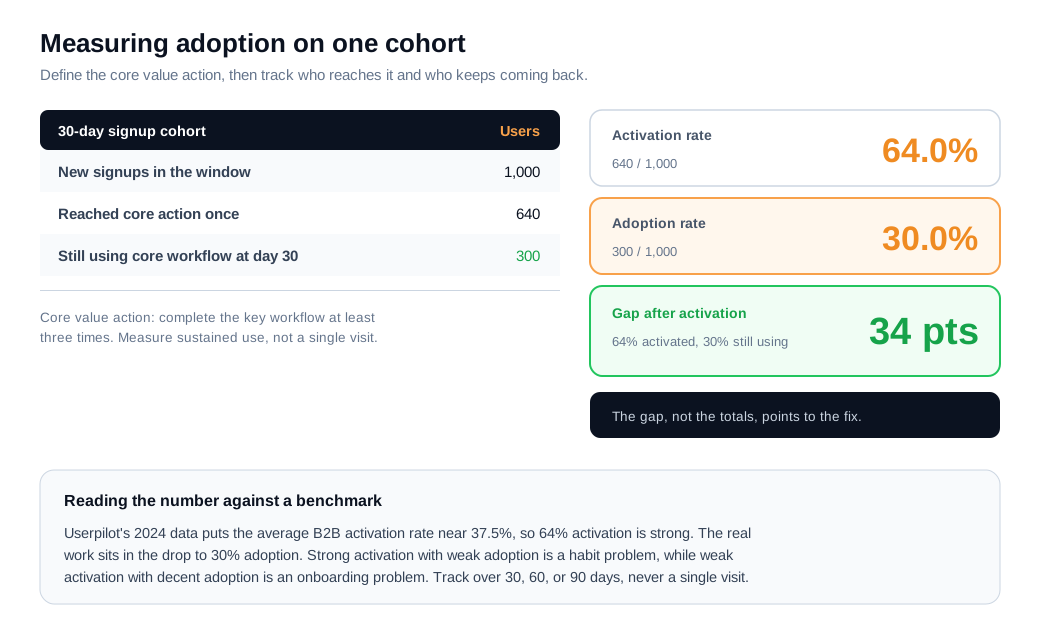
Here is a worked example. A B2B product signs up 1,000 new users in a 30-day window and defines its core value action as completing the key workflow at least three times. Suppose 640 users reach that milestone once, so the activation rate is 640 divided by 1,000, or 64 percent. By day 30, only 300 are still returning to the core workflow, so the adoption rate is 300 divided by 1,000, or 30 percent. The activation number looks strong, but the fall from 64 percent activation to 30 percent adoption is the real story, and it points straight at the weeks after the first session as the place to intervene.
Read those numbers together rather than alone. A high activation rate with low adoption means users get the first taste and then drift, which is a habit and engagement problem. A low activation rate with decent downstream adoption means the front door is too narrow, which is an onboarding problem. The two ask for different fixes.
What is a good product adoption rate?
A good product adoption rate depends heavily on your product, price, and segment, but published benchmarks give a useful anchor to judge yourself against. Userpilot's 2024 activation study, drawn from data across dozens of B2B companies, put the average activation rate at about 37.5 percent with a median near 37 percent, as reported in its user activation rate benchmark. Land above that and your front door is doing well; land below it and activation is likely your first bottleneck.
Resist the urge to chase a single headline figure. Pendo's finding that 80 percent of features go rarely or never used is a reminder that whole-product adoption will always look low, because most users only need a slice of what you built. The number that matters is adoption of the core features that deliver your value, and for those a healthy product often sees far higher rates than the whole-product average.
The most useful benchmark is your own past. Set a baseline for adoption of each core feature this quarter, then work to beat it next quarter. A rate that is climbing on the features that matter tells you more than any industry average, because it reflects your product, your users, and the specific changes you made.
What tactics increase product adoption?
The tactics that reliably increase adoption all serve one goal: getting a new user to the product's core value faster, and clearing away every reason to stall on the way there. Appcues frames the fastest lever as compressing time to value, since every extra step, click, or moment of confusion between signup and the aha moment sheds users.
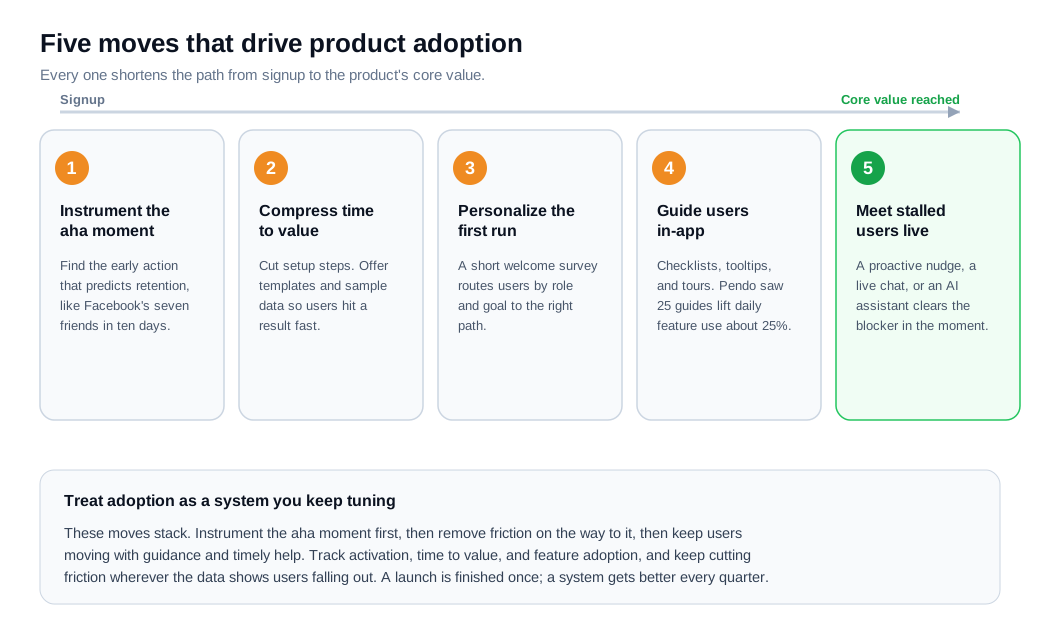
Start by defining the aha moment precisely and instrumenting it. The classic example is Facebook, which found that users who reached seven friends in ten days were far more likely to stick and made that single metric the company's focus, as Startups.com recounts in its guide to activation. Find the equivalent action in your product, the thing that predicts long-term retention, then design onboarding to drive new users toward it.
From there, the tactics stack:
- Compress time to value. Cut setup steps, offer templates or sample data, and let users reach a result before they have to configure anything.
- Personalize the first run. A short welcome survey that asks a user's role and goal lets you route them down the right path, a pattern the welcome messages and flows guide walks through.
- Guide users inside the product. Checklists, tooltips, and short tours pull users toward the next milestone. Pendo found that deploying at least 25 in-app guides lifted the number of features used daily by around 25 percent.
- Meet stuck users in the moment. When a user stalls on a key step, a well-timed proactive outreach nudge or a quick live chat session can surface the blocker faster than a support thread that drags across days, and an AI chat assistant can answer common setup questions the instant they come up.
The through-line is that adoption is a system you keep tuning rather than a launch you finish. Track activation, time to value, and feature adoption, then keep removing friction wherever the data shows users falling out.
How does product adoption affect retention?
Product adoption is the strongest leading indicator of retention, because a user who has built the product into a real workflow has every reason to stay and a real cost to leaving. Retention is the lagging result, and adoption is the behavior weeks earlier that decides it. This is why teams that watch adoption closely can often see churn coming long before the cancellation.
The chain runs from adoption to retention to expansion. A user who adopts the core features keeps renewing, and adopted accounts are the ones most likely to add seats, upgrade tiers, and pull in more of the product, which shows up as expansion revenue. Roll that up and it lands on net revenue retention, the metric that tracks whether your existing base grows or shrinks on its own.
The size of the prize is well documented. McKinsey's analysis of more than 100 B2B software companies found that top-quartile performers on valuation run net revenue retention near 113 percent, against 98 percent for the bottom quartile, a 15-point spread worth billions in aggregate enterprise value. Net revenue retention above 100 percent means expansion from existing customers is outrunning churn, and adoption is the behavior that produces it.
That makes driving adoption one of the cheapest retention levers available, because you are working with users who already chose your product and want it to work. Closing the gap between activation and sustained use does more for the revenue base than almost any win-back campaign aimed at users who have already decided to leave.
Key takeaways
- Adoption is the step between signup and real use, the sustained state where a user returns to your core features by habit, and it is distinct from activation, the single first-value moment that comes before it.
- Map the journey as a funnel, from awareness to sign-up, activation, adoption, and expansion, and expect the steepest drop to sit between activation and sustained use, the stage most teams neglect.
- Measure a real adoption rate, the share of new users who reach and keep using your core value action over 30 to 90 days, and read it alongside activation, time to value, and stickiness.
- Benchmark against yourself first, using outside figures like a roughly 37.5 percent average activation rate as a loose anchor, then set per-feature adoption targets and beat them quarter over quarter.
- Drive adoption by compressing time to value, instrumenting the aha moment, personalizing onboarding, guiding users in-app, and meeting stalled users in the moment with a nudge or live help.
- Adoption compounds into revenue, because it leads retention and expansion, and the highest-retention software companies run net revenue retention around 113 percent against 98 percent for the laggards.

Written by
Nilas MylerCo-founder & CTO, Glimpze
Nilas is the co-founder and CTO of Glimpze, an inbound sales tool that turns high-intent website visitors into live conversations. A former SEO consultant for some of the largest companies in Denmark, he writes about speed-to-lead, inbound sales, and conversion rate optimization — the technical and operational mechanics of turning traffic into pipeline.


