
On this page
Two teams launch trials the same week and each buys 1,000 signups. One drops every new user behind a six-field form, an email verification, a survey, and a blank dashboard, then waits. The other asks three questions, preloads a sample project, and shows the user a finished report before their coffee cools. Ten days later the second team has kept most of those users. The first is watching its trials go dark.
The variable that split them is time to first value. It is the clock that starts the second someone signs up and stops the first time your product does something genuinely useful for them. The shorter that clock, the more of your hard-won signups survive the fragile opening days, when they privately decide whether the tool is worth a second visit.
This guide covers what time to first value is, how it differs from time to value, what a good benchmark looks like, the friction that stretches the clock, how to find your own first-value moment, and the concrete moves that shorten it.
What is time to first value?
Time to first value is the elapsed time between a user signing up and the first moment they see your product deliver a real, observable benefit. It measures the gap between "I just created an account" and "this actually did something for me," and shorter is almost always better.
The word "first" carries the weight here. A user does not need the full outcome they eventually bought to feel a spark of value. They need one concrete win: the first report that answers a real question, the first message that gets a reply, the first file that syncs, the first chart that renders from their own data. PayProGlobal defines it as how long it takes a user to experience the first significant benefit from a product after they start using it, and that first benefit is what convinces someone the tool is worth a second session.
Everything before that moment is cost. The user is spending effort, attention, and patience, and has received nothing back. Every extra screen, field, and confirmation in that stretch is a place they can decide the payoff is not coming and close the tab. That is why time to first value is worth measuring on its own, apart from completion rates or feature tours that can look busy while the user still has no idea why the product matters.
How is it different from time to value?
Time to first value marks the earliest small win, while time to value marks the full outcome the customer actually bought. Both clocks start at signup, but they stop at different milestones, and confusing them leads teams to optimize the wrong one.
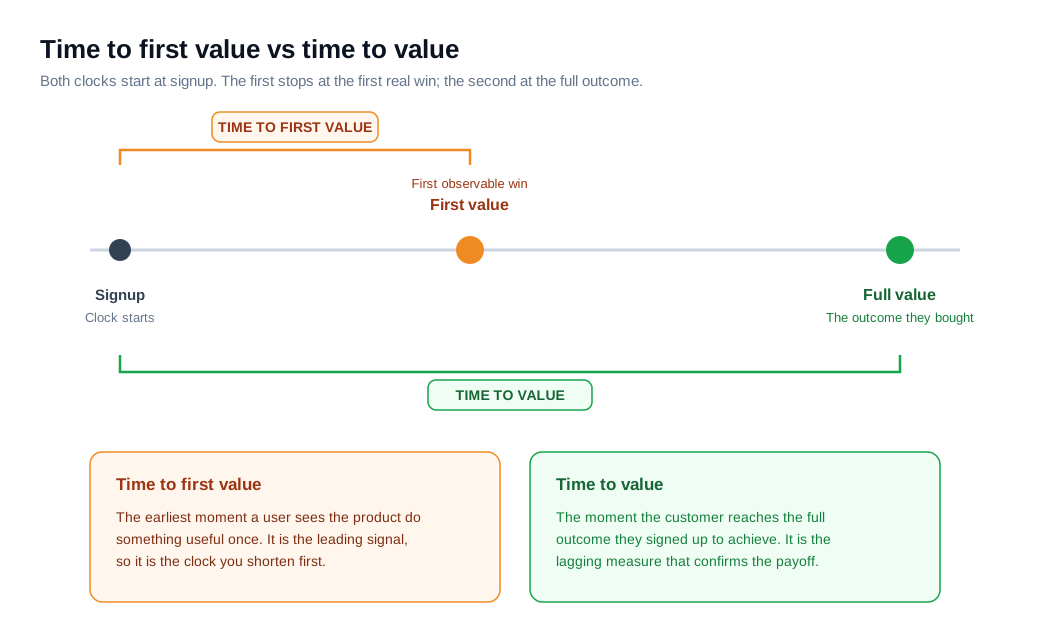
Picture an analytics product. The first-value moment might be connecting one data source and seeing a single live chart, which a motivated user could reach in minutes. Full value, the outcome they signed a contract for, might be a weekly executive dashboard the whole team trusts, which takes weeks of setup and adoption to reach. Time to first value stops at the first chart. Time to value stops at the trusted dashboard.
The distinction matters because the two clocks call for different work. Time to first value is a leading signal you can move this week by cutting steps out of the first session. Time to value is a lagging measure of the whole relationship that depends on adoption, data quality, and habit. Amplitude makes the case that users decide to stay or go in days or even hours, based on whether the product delivered on its promise quickly, which is exactly the window the first-value clock governs. Shorten the first win and you buy yourself the runway to reach the full one.
Many teams use the two terms interchangeably, and that is fine as long as you are clear about which milestone you are counting toward. When someone says they want to reduce time to value, the fastest lever is usually the first-value clock, because it is the one a new user is watching in real time.
What is a good time to first value benchmark?
A good time to first value target for most self-serve B2B products is measured in minutes, and the gap between average and excellent is enormous. Userpilot's benchmark across 547 SaaS companies found the median time to value sits at 1 day, 12 hours, and 23 minutes, while top-quartile products get a new user to value in under five minutes.
Sit with that spread for a second. The typical product makes a user wait a day and a half. The best make them wait less than the time it takes to read this section. Most of the difference has little to do with the product's underlying complexity. It comes down to how many steps the team put between signup and the first win.
The activation numbers tell the same story from another angle. Userpilot's activation benchmark puts the average activation rate at 37.5%, meaning nearly two-thirds of signups never reach the core value of the product they chose. A slow first-value clock is one of the main reasons that figure stays low, because users abandon before the payoff ever arrives.
Treat these numbers as a reference, not a rule. The right target depends on what you sell, since a self-serve utility should aim for minutes while a complex platform can reasonably measure its first win in a day or two. The useful habit is to measure your own number, compare it to where you were last quarter, and watch it fall as you cut friction. If you have never timed the path from signup to first win, that single measurement usually surfaces steps nobody realized were there.
What friction delays first value?
The friction that delays first value is almost always self-inflicted: signup fields, verification gates, surveys, blank screens, and configuration the first win does not actually require. Each one adds minutes, and each one hands the user another reason to quit before the payoff.
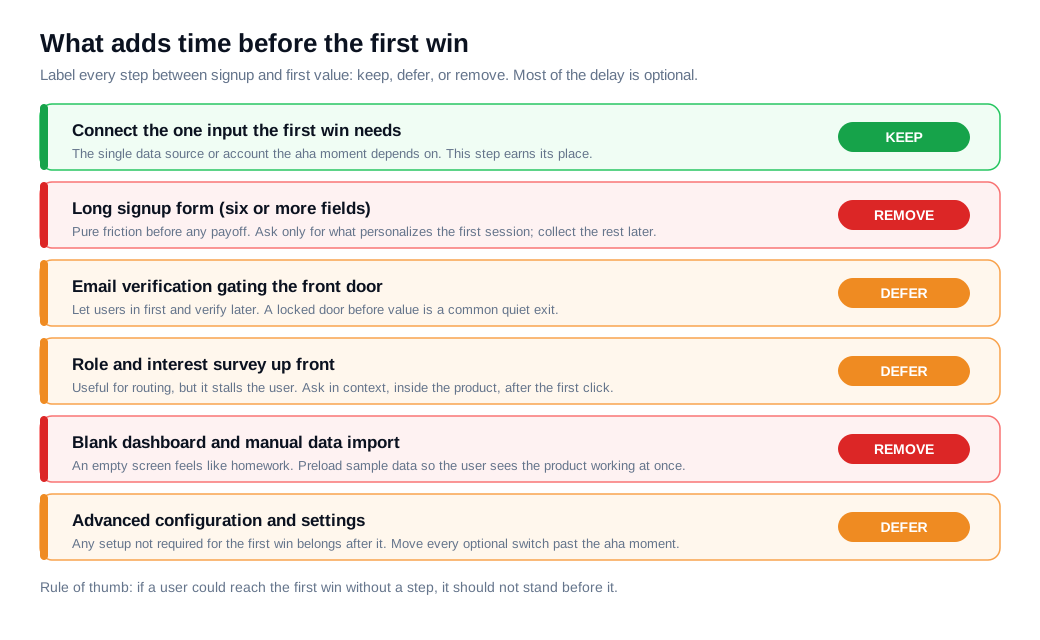
Start at the signup form, because it sits before any value at all. Userpilot's own guidance names the signup flow as the number one source of friction that makes users leave, and the fix is to ask only for what you need to personalize the first session and gather the rest once the user is inside. A six-field form, an email verification that locks the front door, and a role survey can burn several minutes and several exits before the product has shown anything.
Inside the product, the classic delay is the blank first screen. An empty dashboard reads as homework, and a user who has to import data or build something from scratch before seeing any output is a user you are likely to lose. Configuration is the other common trap. Any setting, integration, or permission that is not strictly required for the first win belongs after it, because every optional switch you place before the payoff is a step where someone stalls.
There is a clean way to audit this. ProductLed's straight-line onboarding method has you map every step and label it green, yellow, or red, with green for required, yellow for defer until later, and red for remove entirely. Run that pass on your own first session and the wasted steps stop hiding. Most teams find that half of what stands between signup and first value is yellow or red.
How do you find your first-value moment?
You find your first-value moment by identifying the single early action that best predicts whether a user sticks around, then treating that action as the finish line of the first session. It is the same discipline behind every famous activation metric.
Slack is the cleanest example. The company found that once a team had exchanged around 2,000 messages, it had genuinely tried the product and tended to stay, so 2,000 messages became Slack's activation metric and the target its onboarding drove toward. The exact number mattered less than the discipline of naming one measurable event that separates the users who stay from the ones who leave.
To find yours, run a cohort analysis. Compare the early behavior of users who were still active after 30 days against those who churned, and look for the action the survivors took that the leavers did not. In a project tool it might be creating a first project and inviting one teammate. In an analytics product it might be connecting a source and viewing one live chart. Write that event down as a single sentence the whole team agrees on, because a vague first-value moment produces a vague onboarding flow.
Then anchor the first session to it. A welcome message flow can confirm the outcome each new account came for and point it straight at that one action, which keeps the opening pointed at the win instead of wandering through features. Once the moment is named and instrumented, you finally have a clock you can shorten on purpose rather than by guesswork.
How do you accelerate time to first value?
You accelerate time to first value by removing every step between signup and the first win that does not have to be there, then making the steps that remain easier and better supported. The work is subtractive first and additive second.
Start subtractive. Cut the signup form to the fields you genuinely need, defer email verification until after the user is inside, and move any survey into the product where you can ask in context. Preload sample data so nobody faces a blank screen, and push every optional configuration past the first-value moment. Canva reportedly cut its time to value in half by understanding what problem each user came to solve and shaping the opening around it, instead of presenting the same generic tour to everyone.
Then add support at the exact points where users still stall. A live chat prompt that appears when someone pauses on a setup screen catches the person who is stuck before they give up, and for a sticking point that is faster to show than to type, a quick screen-share call can walk a valuable account past it in two minutes. Reaching a user in the moment they stall, rather than a day later in an email, is what keeps the clock short for the accounts most worth keeping.
Here is the math on one cohort. A B2B SaaS priced at $60 per seat signs 1,200 trials a month. Its first run takes eleven steps: a six-field signup, an email verification, a role survey, then a blank dashboard and a manual data import before the first report appears. Time to first value sits near 22 minutes and activation at 33%. The team names the first-value moment as the first live report built from imported data, trims the signup to three fields, preloads a sample dataset, and moves verification and the survey to later, leaving four steps to the win.
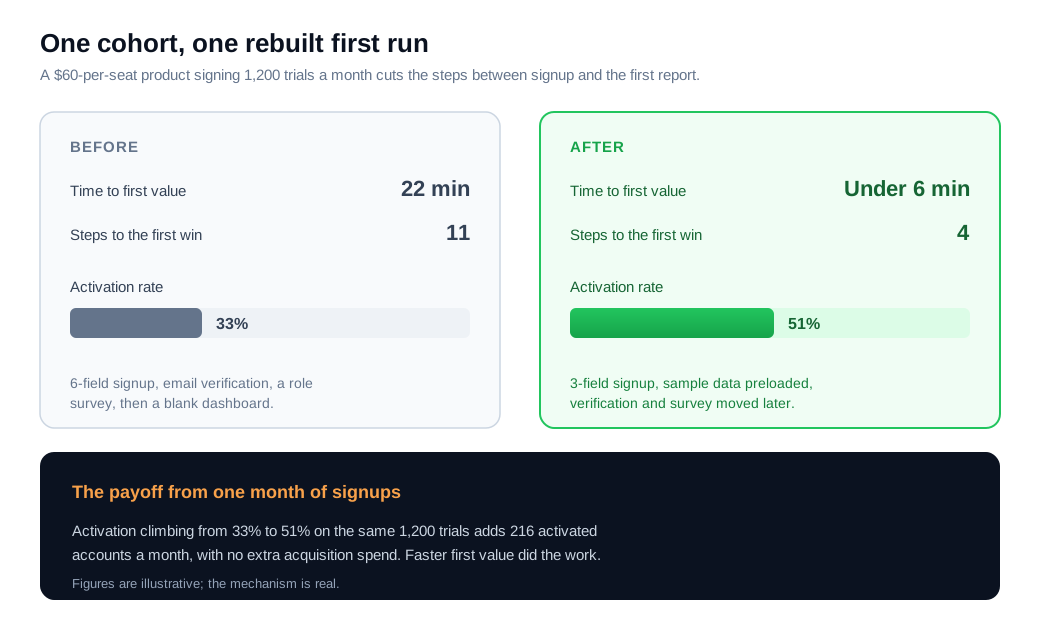
Time to first value falls under six minutes and activation climbs to 51%. On the same 1,200 trials, that lift adds 216 activated accounts a month, none of them from spending an extra dollar on acquisition. Run that across twelve monthly cohorts and the retained users compound into real revenue, all of it earned by getting people to the first win faster. The figures here are illustrative, but the mechanism is exactly what the benchmarks describe.
One caution keeps this honest. A shorter first-value clock only helps if the first win is a real one, so anchor every change to activation and 30-day retention rather than to how fast users click through a tour. A flow that rushes people past a hollow milestone will post a quick time to first value and still churn.
Key takeaways
- Time to first value is the clock from signup to the first real win. It stops the first time the product does something observably useful, and everything before that moment is cost you want to trim.
- It is the leading signal; time to value is the lagging one. The first-value clock moves this week by cutting steps, while full time to value depends on adoption and habit over weeks.
- The benchmark gap is huge. Across 547 SaaS companies the median time to value is 1 day, 12 hours, and 23 minutes, while top-quartile products reach value in under five minutes and average activation sits at 37.5%.
- Most of the friction is optional. Signup fields, verification gates, surveys, blank screens, and advanced settings stretch the clock, so map every step and label it keep, defer, or remove.
- Name one first-value moment and build toward it. Use cohort analysis to find the early action that predicts retention, the way Slack landed on 2,000 messages, then point the first session at it.
- Cut first, then support. In the worked example, trimming eleven steps to four dropped time to first value under six minutes and lifted activation from 33% to 51%, worth 216 extra activated accounts a month from the same trials.

Written by
Nilas MylerCo-founder & CTO, Glimpze
Nilas is the co-founder and CTO of Glimpze, an inbound sales tool that turns high-intent website visitors into live conversations. A former SEO consultant for some of the largest companies in Denmark, he writes about speed-to-lead, inbound sales, and conversion rate optimization — the technical and operational mechanics of turning traffic into pipeline.


