
On this page
Two thousand people create an account with your product this month. Six weeks later, fewer than 300 of them still use it for the job it was built to do. The rest registered, clicked around for a few minutes, and quietly left, most of them inside the first day or two.
Those sign-ups did not lose interest at random. They stalled at specific, repeatable points between the moment they registered and the moment the product first paid off for them. A user onboarding funnel is the map of that stretch, broken into stages, with a completion rate on each step that tells you how many people moved forward and how many slipped away.
This post covers what a user onboarding funnel is, why it decides so much of your growth, the stages it runs through, how to find the exact points where new users drop off, how to lift completion with a worked example, and what a healthy funnel actually looks like.
What is a user onboarding funnel?
A user onboarding funnel is a model of the steps a new user takes from sign-up to the moment they first get real value from your product, with the completion rate measured between each step. It is drawn as a funnel because the group shrinks at every stage: a wide pool of new sign-ups enters at the top, and a smaller number reaches the bottom as activated, retained users.
The goal at the bottom of this funnel is a value moment rather than a purchase. It is the first time a user does the thing your product exists to do and gets something back for it: imports their data and sees a live dashboard, sends the first message that gets a reply, ships the first project. Teams call that the activation or value moment, and the onboarding funnel exists to move as many new users to it as possible.
That makes the onboarding funnel a different animal from the sales funnel that sits above it. A sales funnel ends when someone signs up or buys. The onboarding funnel begins there and runs until the user has felt the product work and come back to do it again. In the AARRR or pirate metrics framework popularized by Dave McClure, onboarding is the bridge that carries a new user across acquisition into activation, then feeds retention (Amplitude). Map that bridge as measurable stages and you can see exactly where new users cross and where they fall in.
Why does the user onboarding funnel matter?
The onboarding funnel matters because it is where most of the money you spent acquiring users is either kept or lost, and the loss happens fast. A new user who never reaches value rarely comes back, so a weak funnel quietly drains the top-line growth your marketing paid for.
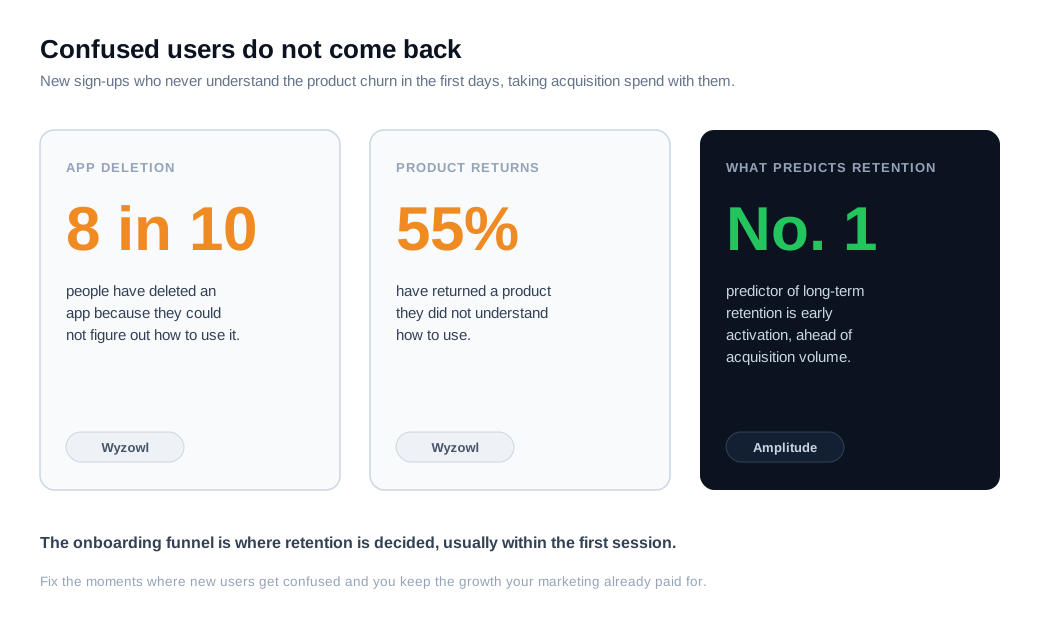
The behavior is well documented. Wyzowl's customer onboarding research found that roughly 8 in 10 people say they have deleted an app because they did not know how to use it, and 55% say they have returned a physical product for the same reason. The same study reported that 86% of people say they would be more likely to stay loyal to a business that invests in onboarding content after the purchase (Wyzowl). Confusion in the first session is one of the most common reasons a sign-up never becomes a user.
There is a timing reason the funnel deserves attention too. Amplitude's analysis of thousands of products found that early activation is the single strongest predictor of long-term retention, and that a cohort's seven-day activation gives you an early read on its three-month retention (Amplitude). The onboarding funnel is where that early signal is created. A drop-off you catch on day three is a cohort you can still rescue, while a retention problem you notice at month three is mostly a post-mortem.
What are the stages of a user onboarding funnel?
Most onboarding funnels run through five stages: sign-up, account setup, the first key action, the value moment, and early retention. The labels vary by product, and the discipline is to name the stages as the real events a new user actually touches, because you can only measure what you have named.
Sign-up. A visitor commits enough to create an account: email and password, a social login, or a workspace name. This is the top of the funnel and the widest point.
Account setup. The user completes the steps that make the product usable: confirms an email, fills in a profile, picks a plan or a use case, sets basic preferences. Long or unclear setup is a classic early leak.
First key action. The user does the one setup step that makes value possible: connects a data source, imports a file, invites a teammate, or creates the first project. This action is inside their control and it sets up everything below it.
Value moment (activation). The user experiences the core value for the first time and gets a result back. This is the aha the whole funnel points at. Facebook's growth team famously found that new users who reached seven friends in ten days almost always stuck around, and Slack landed on a team exchanging roughly 2,000 messages. Each product has its own version.
Early retention (the habit). The user comes back and does the valuable thing again, turning a one-time success into a routine. This is where activation converts into durable retention.
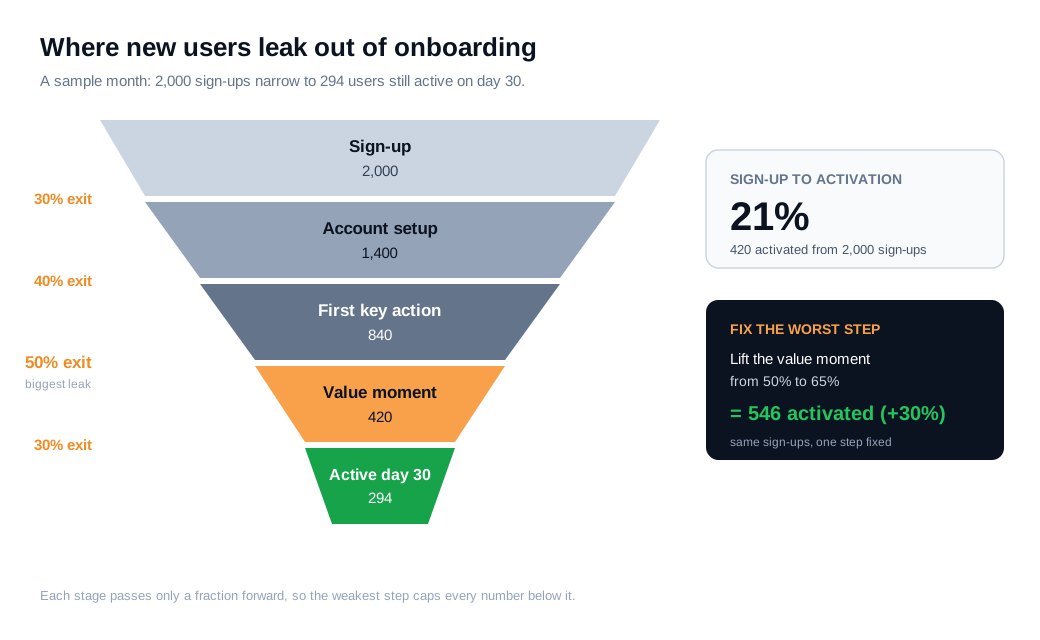
Here is a worked example. Say 2,000 people sign up in a month. Of those, 1,400 finish account setup (70%), 840 complete the first key action (60% of the previous stage), 420 reach the value moment (50%), and 294 are still active on day 30 (70%). That is a 21% sign-up-to-activation rate, and the single worst step is the 50% drop at the value moment, where 420 people fall out right before the product would have paid off.
How do you find drop-off points in the funnel?
You find drop-off points by instrumenting each stage as a tracked event, measuring the completion rate between consecutive stages, and then ranking the drops by what they cost rather than by which percentage looks biggest. A funnel report turns one blurry number, your overall activation rate, into a series of stage-to-stage rates that show exactly where the loss happens.
Start by mapping the funnel to real events. Every stage should be a named event in your analytics: account_created, setup_completed, data_connected, first_value, day_30_active. Product analytics tools like Amplitude, Mixpanel, or a GA4 funnel exploration then chart the conversion and drop-off between them.
Segment before you conclude. Aggregate funnel data is a starting point, not an answer, because the same funnel often performs very differently across acquisition source, plan, device, and cohort (VWO). Split the sign-up cohort into users who activated and users who did not, then compare their paths step by step. A funnel that looks healthy in total can hide a source that barely activates at all.
Then move from where to why. A funnel report tells you which step leaks, and session replays tell you what users actually did there. Watch enough recordings of the leaking step to name the top two or three failure modes, then stop. The fastest source of why, though, is the user still on the page. A quick question over live chat when someone stalls on setup often surfaces the exact blocker in one sentence, which no dashboard will give you.
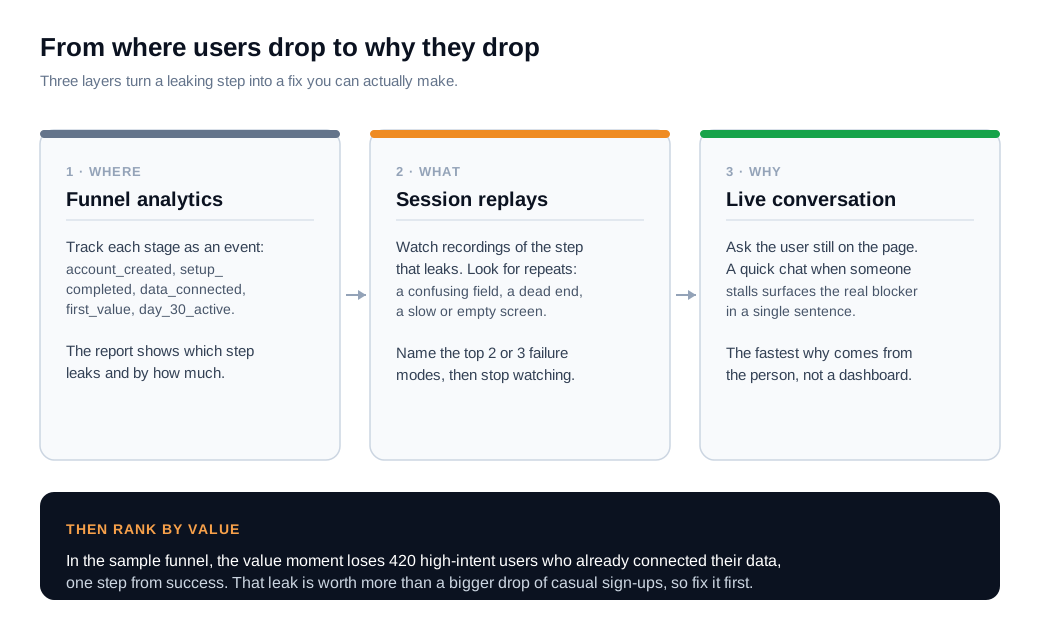
Finally, rank the leaks by value, not by headcount or percentage. In the worked example, the 50% drop at the value moment loses 420 high-intent users who already connected their data and were one step from success. Recovering a slice of that group is worth more than nudging casual sign-ups who may never have committed. Fix the highest-value leak first.
How do you improve funnel completion?
You improve funnel completion by shortening the path to the value moment, pointing every new user at one clear first action, and removing the specific friction at whichever step leaks most. Broad redesigns rarely move the number. Targeted fixes at the weakest high-value step do.
Shorten time to value. The biggest lever is getting users to a real outcome faster. Preload sample data so a new account is not a blank page, ship templates so the first useful result is one click away, and cut any setup step that is not strictly required to see the product work. Empty states are where onboarding goes to die.
Guide users toward one activation action. A short, outcome-based checklist of three to five steps ("connect your data," "invite a teammate," "publish your first report") consistently beats a passive product tour, because it gives the user a reason to move. Keep expectations realistic: Userpilot's 2025 benchmark of 188 B2B SaaS companies put the average onboarding checklist completion rate at 19.2% and the median at 10.1% (Userpilot), so a checklist is a nudge toward value, not a box most users will tick.
Trigger help in context. Fire a welcome flow, a tooltip, or a tip when a user reaches a step, not on a fixed day of the trial. A guided welcome message and flow that lands the moment someone opens the setup screen does more than a generic email two days later, because the help arrives while the problem is live.
Cut form and setup friction. Ask for the minimum you need to get someone to value now, and collect the rest later. Progressive disclosure, sensible defaults, and a visible progress indicator all reduce the odds a user quits mid-setup.
Add a human touch where intent is high. A new user who stalls halfway through setup, or lingers on a pricing page mid-trial, is the most valuable and most fragile traffic you have. Reaching that person in the moment, with a message or a short screen-share call, converts interest an email drip would let cool. You do not need to chase every free sign-up, only the small set showing real intent, which is the core of a modern inbound sales motion built on speed. A proactive nudge can open that conversation automatically the moment a user gets stuck.
Return to the worked example to see why one step is worth the effort. Lift only the value-moment step from 50% to 65% and, with the same 2,000 sign-ups, activated users rise from 420 to 546. At the same 70% day-30 retention, that carries through to 382 retained users instead of 294. One step, moved 15 points, produced about 30% more activated and retained users with no extra acquisition spend. That is the multiplicative math of a funnel: the weakest stage caps everything below it, so fixing it lifts every number downstream.
What is a good onboarding funnel completion rate?
There is no single good number, but a few benchmarks tell you whether a stage is genuinely broken or just normal. The most useful reference for the bottom of the funnel is activation rate, the share of sign-ups who reach the value moment. Userpilot's 2024 benchmark of 62 B2B SaaS companies put the average at 37.5% and the median at 37% (Userpilot), so the mid-to-high 30s is a fair center of gravity.
The spread around that median matters more than the median itself. In the same report, healthcare products averaged about 23.8% while AI and machine learning products averaged 54.8%. Motion moves it too: self-serve products carry more idle sign-ups and tend to activate lower, while sales-assisted products, where a human helps with setup, sit higher. A blended average across sources hides all of this, which is why the real target is your own cohort measured over time.
Treat any benchmark as a sanity check rather than a goal. Segment your funnel by acquisition source, watch the stage-to-stage rates move quarter over quarter, and improve the weakest high-value step. A niche B2B tool that activates 25% of a highly qualified audience can be healthier than a consumer app that activates 45% of curious tire-kickers.
Key takeaways
- A user onboarding funnel maps the stages between sign-up and first value, turning one vague activation number into stage-to-stage rates that show exactly where new users drop off.
- The funnel decides whether acquisition spend sticks. Wyzowl found roughly 8 in 10 people have deleted an app because they could not figure out how to use it, and Amplitude ties early activation to long-term retention.
- Name the stages as real events. A typical funnel runs sign-up, account setup, first key action, value moment, and early retention, and you can only measure the steps you have defined.
- Find leaks with events, segments, and replays, then rank by value. A funnel report shows where users drop, session replays and a quick live-chat question show why, and the highest-value leak gets fixed first.
- Improve completion by shortening time to value. Preload data, guide users to one activation action, trigger help in context, and add a human touch when high-intent users stall.
- Benchmark against yourself. Userpilot's 2024 study put average B2B activation near 37.5%, but verticals ran from about 24% to 55%, so beat last quarter rather than a headline number.

Written by
Nilas MylerCo-founder & CTO, Glimpze
Nilas is the co-founder and CTO of Glimpze, an inbound sales tool that turns high-intent website visitors into live conversations. A former SEO consultant for some of the largest companies in Denmark, he writes about speed-to-lead, inbound sales, and conversion rate optimization — the technical and operational mechanics of turning traffic into pipeline.


