
On this page
A product team ships a flashy new signup flow, watches registrations climb 30 percent, and celebrates. Ninety days later, revenue has barely moved. All those new accounts logged in once, poked around, and never came back. The flow got people through the door. It never got them to the reason they walked in.
That gap has a name. Activation is the stage where a new user goes from "I signed up" to "I see why this matters," and it is the single point in the funnel where a small improvement pays off the longest. Appcues modeling found that a 25 percent increase in activation rate can translate to roughly a 34 percent increase in monthly recurring revenue over 12 months, because activation feeds every metric downstream of it.
This post covers what user activation is, what a good activation rate looks like, how to define the activation event for your own product, the tactics that reliably move it, how to measure the lift you get, and the mistakes that quietly cap your results.
What is user activation?
User activation is the point at which a new user first experiences the core value of your product, the moment the thing you built actually does something useful for them. Analytics teams usually express it as a rate: the percentage of new signups who reach that moment within a defined window.
The emotional side of this is the "aha moment," the instant the product clicks and the user understands why it belongs in their day. Activation is that realization turned into a number you can track. As Amplitude frames it, activation rate measures the share of new users who complete the action or set of actions that signal they have felt your product's value for the first time.
It helps to see where activation sits in the wider journey. Most products move a user through four moments: the sign-up, the setup where they complete whatever steps are needed to reach value, the aha moment where value lands, and the habit moment where regular use takes hold.
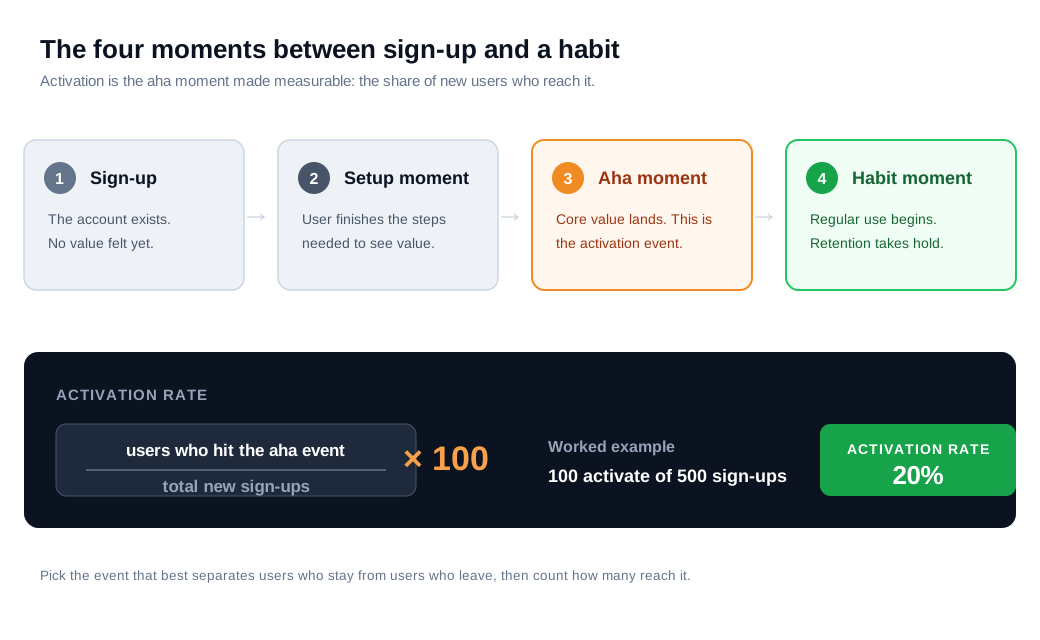
The math is plain. Divide the users who hit your activation event by total new signups, then multiply by 100. If 100 of 500 new users complete the key action in their first week, your weekly activation rate is 20 percent.
Activation earns its attention because it gates everything after it. A user who never reaches value will not retain, will not expand, and will not refer. That is why activation carries the largest downstream impact of the AARRR "pirate metrics," and why Appcues argues it is the highest-return stage to fix before you spend more on acquisition.
What is a good user activation rate?
A good user activation rate depends heavily on your category, but the median B2B SaaS product lands around the high 30s. In Userpilot's 2024 benchmark study of 62 B2B companies, the average activation rate was 37.5 percent and the median was 37 percent.
The spread around that average is what matters. The same Userpilot report put AI and ML products at 54.8 percent, well above the pack, and healthcare products at 23.8 percent, well below it. Products that reach value in a few clicks activate more users than products that require configuration, data import, or compliance steps before anything useful happens.
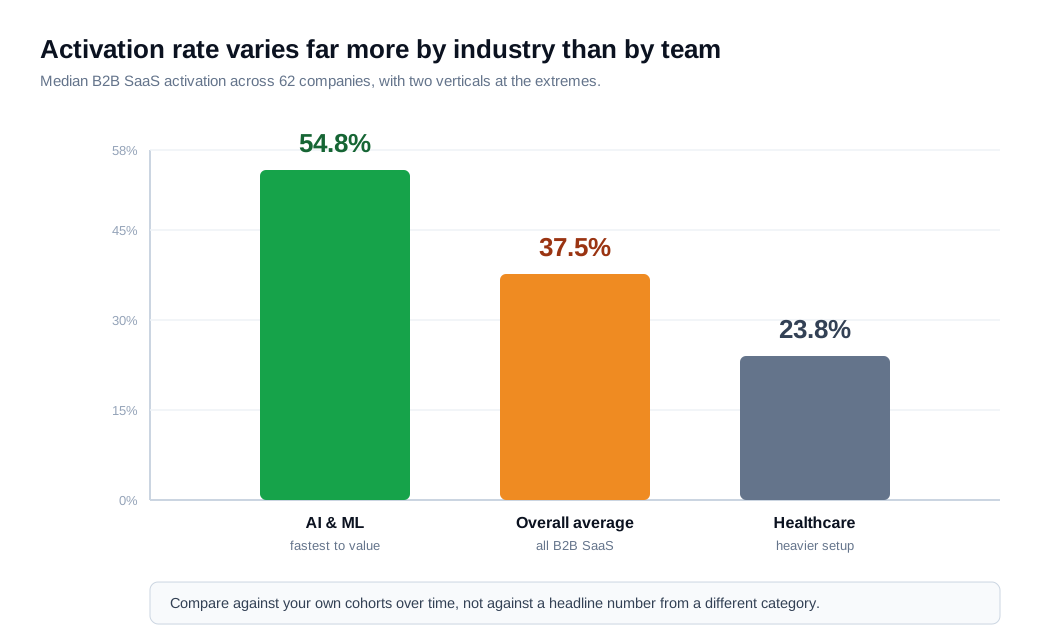
Treat these numbers as orientation, not a target. A 30 percent activation rate might be excellent for a data-heavy enterprise tool and mediocre for a lightweight consumer app. The useful comparison is against your own history: is this month's activated cohort larger than last quarter's, and are those activated users retaining better than the ones who never activated? If activated and non-activated users retain at the same rate, your activation event is measuring the wrong thing, which is the next problem to solve.
How do you define an activation event?
You define an activation event by finding the early action that best separates users who stay from users who leave, using your own cohort data rather than a guess. The candidate actions are the things a new user can do in their first days. The winner is the one most tightly correlated with long-term retention.
The method, laid out well in Lenny Rachitsky's guide to determining an activation metric, is a cohort analysis. Take users from the last several months, list the actions they took early, and compare the day-30, day-60, and day-90 retention of users who took each action against those who did not. The actions with the widest retention gap are your candidates.
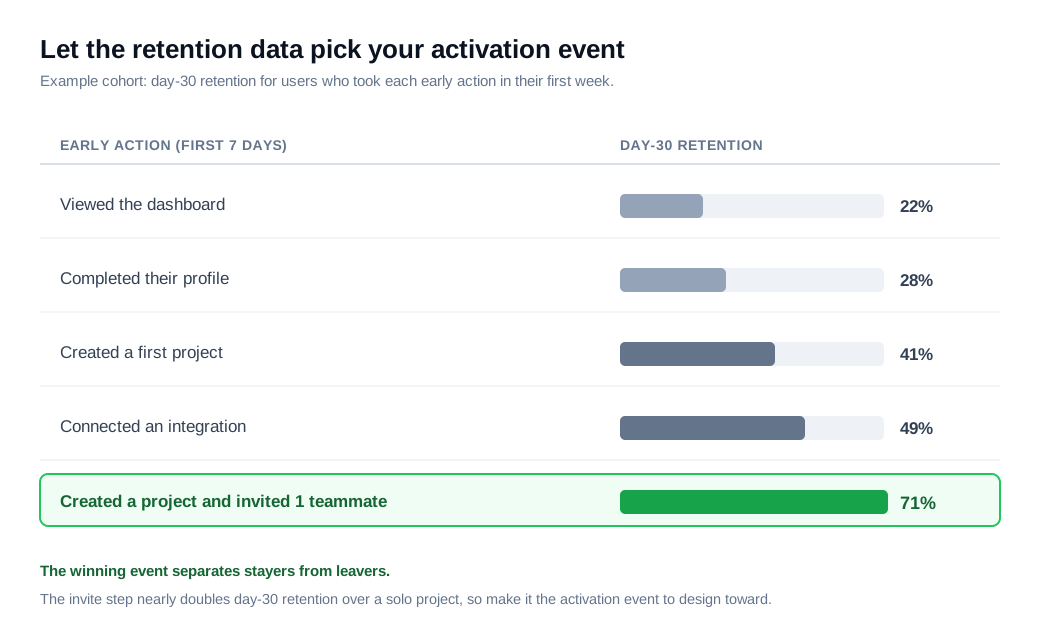
Here is a worked example. Say you run a project tool. Over the last six months, you look at day-30 retention for each early action a new user could take. Users who only viewed the dashboard retained at 22 percent. Users who completed a profile retained at 28 percent. Users who created a first project retained at 41 percent. Users who connected an integration retained at 49 percent. Users who created a project and invited one teammate retained at 71 percent. The invite step nearly doubles retention over a solo project, so "created a project and invited a teammate" becomes your activation event.
Two cautions keep this honest. First, correlation is not causation. Before you build your whole onboarding around an event, check that pushing more users to it actually raises retention, rather than just marking users who were already committed. Second, keep the event within reach in the first session or two. An activation event that takes a week to hit is a retention milestone, not an activation one.
The classic examples make the pattern concrete. Facebook found that users who added a certain number of friends early were far likelier to stick, later distilled into the "seven friends in ten days" idea that Mode traces back to the growth team's cohort work. Slack found its own version: teams that exchanged 2,000 messages retained at 93 percent, a threshold Appcues cites from founder Stewart Butterfield as the point where a team had genuinely tried the product.
What tactics increase activation?
The tactics that increase activation all shorten the path to the activation event and remove reasons to drop off before reaching it. Once you know the event you are aiming at, the work is clearing everything between signup and that moment.
Start with time to value. The longer setup takes, the more users leave before value lands, so cut every step that is not required to reach the aha moment. Let people do optional configuration later. Pre-fill what you can. Offer templates or sample data so a new user can experience the product working before they have done any real setup themselves.
Guide the user with an onboarding checklist tied to the activation event, not to a tour of your features. A short list of three or four steps that end at the aha moment, with visible progress, gives people a reason to keep going. This is where welcome messages and onboarding flows do their work: they point a new user at the one action that matters instead of leaving them to explore a blank screen.
Personalize the path. Ask one or two questions at signup about the user's role or goal, then route them to the setup that fits. A user who says they want to invite a team should land on the invite step, not a generic dashboard.
Reach users at the point they get stuck. Contextual help beats a help center a user has to go find. A new account that has created a project but stalled before inviting anyone is a clear signal to nudge, and answering a setup question in the moment with live chat, or a quick screen share when a picture is easier than a paragraph, can pull a stuck user across the line. You can also automate the first touch with proactive outreach nudges triggered by that exact stall.
The case studies point the same way. Userpilot reports that when the fintech app Blip reworked its onboarding around the value moment, activation rose 124 percent and time to value dropped sharply. Appcues documents The Room using a persistent "driven action" prompt to lift a key setup action by 75 percent within ten days. Both moved a specific early behavior rather than redesigning the whole product.
How do you measure activation lift?
You measure activation lift by running a controlled experiment: split new signups into a control group on the current experience and a test group on the change, then compare activation rate, time to value, and early retention across the two. Without a control, a rising activation number could be a seasonal cohort or a marketing shift rather than your work.
A standard setup, described by Statsig, runs for about 30 days on a slice of new users, often 20 to 40 percent, with the control on the existing onboarding and the test on the existing onboarding plus the new guidance. You watch three numbers: activation rate, time to first value, and day-7 retention. Activation rate tells you whether more users reached value. Time to value tells you whether they got there faster. Day-7 retention tells you whether the lift was real or a hollow bump that faded.
Here is a worked example. Your product activates 20 percent of new users, 100 of every 500 weekly signups. You suspect a checklist tied to the invite step will help, so you run it on 40 percent of new signups for a month. Control activation holds at 20 percent. Test activation comes in at 26 percent. That is a 6 point absolute lift, or a 30 percent relative increase. Because activation compounds into retention and expansion, a relative gain of that size is exactly the kind Appcues modeled into a double-digit MRR effect over a year, which is why you roll it out and then look for the next friction point.
One habit protects all of this. The link between your activation event and retention decays as the product changes, so re-check it every quarter. Confirm that activated users still retain meaningfully better than non-activated ones. If the gap has closed, your activation event has drifted, and you go back to the cohort analysis to find the new one.
What are the most common user activation mistakes?
The most common activation mistake is optimizing a vanity event that does not predict retention, usually "completed onboarding" or "visited the dashboard." Those are easy to move and easy to celebrate, and they tell you almost nothing about whether users found value. A team can push onboarding completion to 90 percent and watch retention stay flat.
A second mistake is front-loading setup. Every field, integration, and permission you require before the aha moment is a place to lose people. The products that activate well defer setup and let users feel value first, then ask for the rest once there is a reason to give it.
A third is treating activation as a launch rather than a loop. The single biggest driver of activation is often a friction point you have not found yet, and the only way to find the next one is to keep instrumenting the funnel, running experiments, and re-validating that your activation event still means what it used to. Teams that stop after one onboarding redesign leave most of the gain on the table.
Key takeaways
- Activation is value realized, measured. It is the share of new users who reach the moment your product proves useful, and it gates retention, expansion, and referrals downstream.
- Let data choose your activation event. Run a cohort analysis and pick the early action with the widest retention gap, then confirm that driving users to it actually lifts retention.
- Benchmark against yourself. The B2B median sits near 37 percent, but the range runs from the low 20s in heavy setup categories to the mid 50s in AI tools, so compare your own cohorts over time.
- Shorten the path to the aha moment. Cut setup steps, personalize the route, add a checklist tied to the value event, and reach stuck users with contextual help.
- Prove the lift with a control. Run a 30-day experiment on a slice of signups and watch activation rate, time to value, and day-7 retention together, not activation alone.
- Re-validate every quarter. The correlation between your activation event and retention decays as the product changes, so keep checking that activated users still stay longer.

Written by
Daniel SemeckyCo-founder & CEO
Daniel is the co-founder and CEO of Glimpze. He spends his days talking to revenue teams about how to catch high-intent visitors before they bounce, and writes about inbound sales, lead conversion, and building a motion where marketing and sales actually share a number.


