
On this page
Two companies run the same lead generation playbook and end the quarter with wildly different numbers. One pays $30 a lead and calls it a win. The other pays $300 and is delighted. Neither figure means much on its own.
A cost per lead only becomes good or bad once you know the channel that produced it, the industry it sits in, and the revenue a lead is worth. A $300 lead that closes a $50,000 contract is a bargain. A $30 lead that never buys is expensive at any price. Public benchmarks help, but only if you read your number against the right column.
This post covers what an average cost per lead actually looks like in the current data, what separates a good number from a merely cheap one, how the figure moves across channels and industries, and how to set a target you can defend to your own finance team.
What is an average cost per lead?
The average cost per lead across B2B channels sits near $84 for paid media and closer to $200 once you blend paid and organic sources together, though no single average travels well between businesses. HubSpot's 2025 CPL and CAC benchmarks put the cross-channel paid average around $84, while First Page Sage's cost per lead data lands nearer $198 for a fuller blended figure that includes slower organic channels.
The gap between those two numbers is the first lesson about averages. One counts only what you paid to an ad platform. The other counts the whole cost of producing a lead, including the content and salaries behind an organic channel. Both are labeled average cost per lead, and they differ by more than double.
Paid search gives the cleanest single benchmark because the data is dense and comparable across advertisers. WordStream's 2025 Google Ads benchmarks put the cross-industry average cost per lead at $70.11, up from $66.69 the year before, a rise of about 5 percent. That figure is a useful anchor precisely because it holds the channel constant, since everyone in the sample is buying the same kind of click.
Treat any headline average as a starting line rather than a goal. It tells you the rough order of magnitude, not whether your own number is healthy.
What counts as a good cost per lead?
A good cost per lead is any figure that leaves room for profit after the lead converts, which means your deal value and close rate set the answer far more than any benchmark table does. A price that would sink one business is comfortable for another selling a larger contract.
Think about the two ends of that range. A law firm signing clients worth tens of thousands of dollars can pay well over $100 for a paid search lead and still profit handsomely, because a small share of those leads pays for all of them. A restaurant or a low-priced consumer brand needs leads in the low tens of dollars to survive, because each customer is worth so little.
This is why the same benchmark chart supports two opposite reactions. When a legal team sees the $131 attorney cost per lead in WordStream's data, that is a normal cost of doing business. When a restaurant sees $30, that is already near its ceiling. What matters is the figure measured against what a customer brings in, not the size of the dollar amount by itself.
So the useful question is what a good cost per lead is for you, which is a calculation you can run rather than a chart you can copy. The benchmarking section below walks through the math.
How does cost per lead differ across channels?
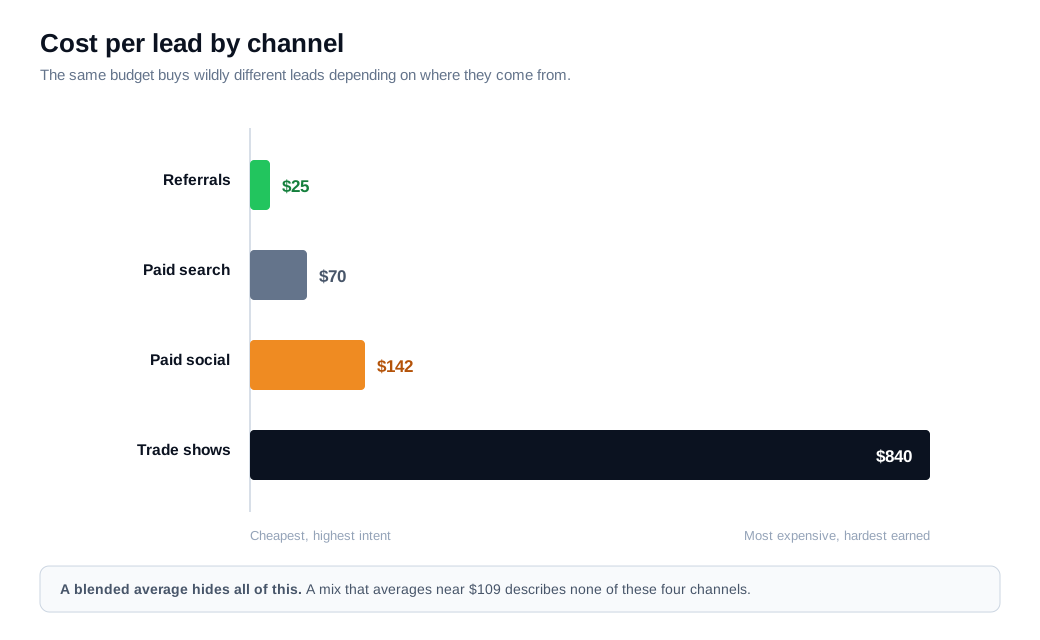
Cost per lead differs across channels by more than thirtyfold, because each channel reaches a different audience at a different level of intent, so a referral and a trade show booth are barely the same metric. Sopro's B2B cost per lead benchmarks show the spread plainly: referrals come in cheapest at roughly $25 a lead, affiliate marketing near $73, paid search around $70, paid social such as Facebook near $142, and events and trade shows at the top around $840.
Intent explains most of that order. A referral arrives pre-warmed by someone the buyer already trusts, so the cost of persuading them is close to zero. A trade show lead has to be found, courted, and pulled away from a hundred competing booths, and the badge scan at the end is expensive before anyone has agreed to anything.
Here is a worked example of why the blend misleads. Say you spend about $40,000 in a month across four channels. Referrals bring 100 leads at $25 ($2,500), paid search brings 150 at $70 ($10,500), paid social brings 100 at $142 ($14,200), and one trade show brings 15 leads at $840 ($12,600). That is roughly 365 leads for $39,800, a blended average cost per lead near $109. The blended figure describes none of your actual channels. It sits far above your cheapest source and far below your most expensive one, and it would never tell you that events cost about 34 times what referrals do.
The practical rule is the same one that governs conversion rate reporting: always divide a channel's spend by that channel's leads, never by total spend. A blended number is fine for a board slide and useless for a budget decision.
How does industry affect cost per lead?
Industry shifts cost per lead as much as channel does, because click prices, competition, and deal sizes all vary by sector, so the same Google Ads setup that yields a $30 lead for a restaurant yields a $130 lead for a law firm. WordStream's 2025 data shows automotive repair leads near $28.50 and restaurant leads near $30.27 at the low end, while attorneys and legal services run about $131.63 and furniture about $121.51 at the high end, all inside the same ad platform.
Two forces drive that spread. High-value industries bid up the clicks, because a signed legal or financial client is worth so much that firms will pay a premium for every visit, which lifts everyone's cost per lead in the auction. Regulated or heavily considered purchases also take longer to convert, so more clicks are spent for each lead captured.
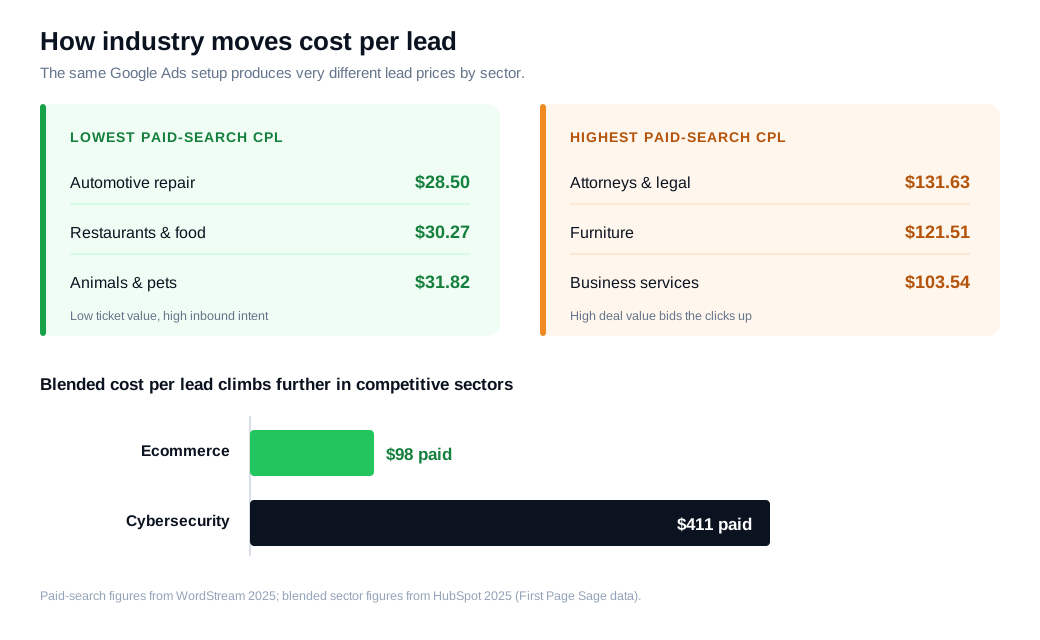
Blended industry figures climb higher still. HubSpot's 2025 benchmarks, drawn from First Page Sage data, show ecommerce among the cheapest at about $83 for organic and $98 for paid, while a competitive sector like cybersecurity lands near $404 organic and $411 paid, and engineering shows paid leads around $371 running close to double its organic ones near $201.
That organic-versus-paid split inside a single industry is worth sitting with. In cybersecurity the two are nearly equal, so the channel choice is close to a wash on cost alone. In engineering, paid costs almost twice what organic does, which tells you exactly where the efficiency lives. Reading a benchmark without its channel and industry columns is how teams end up chasing the wrong number.
How do you benchmark your own cost per lead?
Benchmark your own cost per lead by working backward from what a customer is worth, then sanity-checking that figure against the industry charts, rather than adopting an external average as your target. Start with a lead's value, apply your close rate and margin, and you get the most you can afford to pay.
The formula practitioners use is straightforward: multiply customer lifetime value by your gross margin, then by the rate at which leads become customers. LaGrowthMachine's cost per lead guide frames the affordable target the same way.
Work it through with numbers. Suppose a customer is worth $8,000 in lifetime revenue, your gross margin is 60 percent, and 12 percent of qualified leads close. Multiply $8,000 by 0.60 to get $4,800 in gross profit per customer, then by 0.12 to get $576. That $576 is the ceiling. Pay more than that per lead and you lose money before covering a single salary. Most teams then hold their real target well under the ceiling to keep a healthy return, aiming for a lifetime-value-to-acquisition ratio around 3 to 1, which in this case puts a comfortable cost per qualified lead nearer $190.
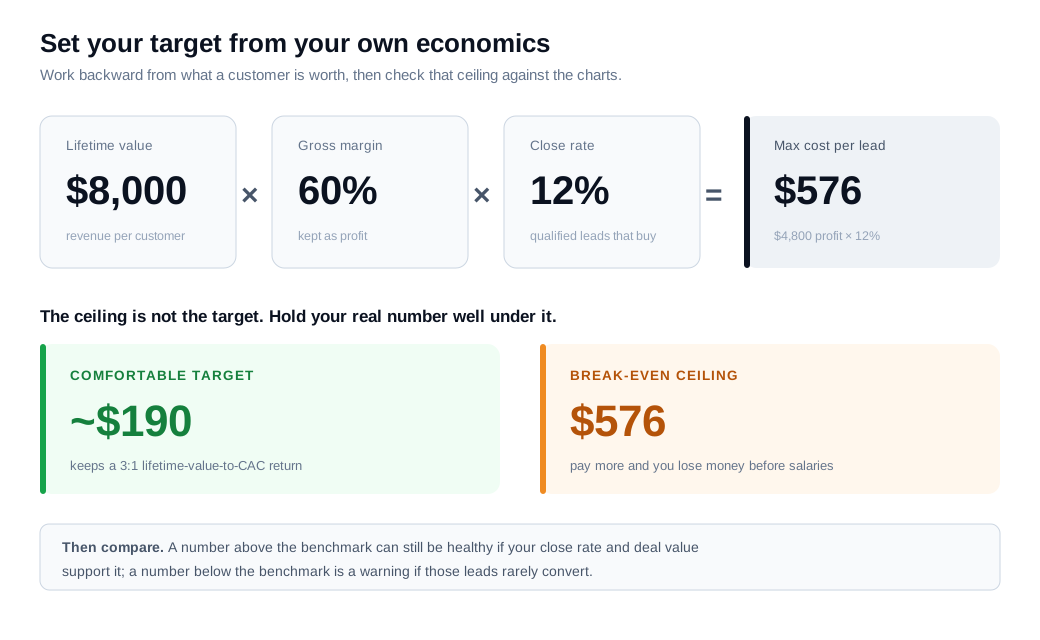
Now compare against the benchmarks. If your own number lands above the industry figure but your close rate and deal value support it, you probably do not have a problem. If it lands below the benchmark but the leads rarely convert, you have a quality problem that a cheaper lead will only deepen.
Three habits keep the comparison honest. First, match the column, comparing your paid search cost per lead to a paid search benchmark and never to a blended average. Second, use a fully loaded number that includes tools, content, and prorated salaries, so you are measuring like against like. Third, track cost per qualified lead alongside the raw figure, since the qualified version is the one that actually predicts pipeline.
Should you always chase the lowest cost per lead?
No, chasing the lowest cost per lead often raises your cost per customer, because the cheapest leads tend to convert at the lowest rates, and cost per customer is the metric that pays the bills. A referral at $25 and a paid social lead at $142 are not interchangeable just because one costs less on the way in.
Run the trap with numbers. Suppose cheap social leads cost $30 and qualify at 4 percent, while referral leads cost $80 and qualify at 40 percent. The cheap lead needs 25 leads to find one qualified buyer, which works out to $750 per qualified lead. The referral needs 2.5, or $200 per qualified lead. The source that looked nearly three times cheaper turns out almost four times more expensive where it counts.
That gap is why speed and quality beat raw price. A lead you already paid for and then let go cold is the most expensive lead of all. Teams that answer high-intent visitors right away, through live chat or a quick call, get more customers from the same spend without touching the ad budget. Fast lead routing and notifications that put a hot lead in front of the right rep in seconds do more for real acquisition cost than shaving a few dollars off a click. For an inbound sales team, the win is converting more of the leads you already have, not buying cheaper ones that never close.
Cost per lead benchmark FAQs
What is a good cost per lead in 2025?
A good cost per lead in 2025 stays a small fraction of the profit a customer brings, which for paid search often means beating the roughly $70 cross-industry average, though high-value B2B sectors can profit at several hundred dollars per lead. There is no single good figure, only one that is good for your margins.
Why is my cost per lead higher than the benchmark?
Your cost per lead can run above the benchmark because your industry has pricier clicks, your channel mix leans toward premium sources like events or LinkedIn, or your landing pages convert below average. Check the channel and industry columns before treating the number as a failure, then look at page conversion, since that is usually the fastest lever.
What is the difference between cost per lead and cost per qualified lead?
Cost per lead counts every contact you capture, while cost per qualified lead counts only those that clear your fit and intent bar, so the qualified figure always reads higher and predicts pipeline far better. Optimize against the qualified version whenever you can define the bar consistently.
Key takeaways
- Averages are anchors, not targets. Paid B2B channels average near $84 per lead and blended figures near $200, but those numbers only tell you the order of magnitude, not whether your own cost per lead is healthy.
- Good is defined by deal value. A cost per lead is good when it leaves profit after the lead converts, so a law firm can thrive at $130 a lead while a restaurant needs it near $30.
- Channels differ by more than thirtyfold. Referrals run near $25 and trade shows near $840, so a blended average hides both your cheapest and most expensive source and should never drive a budget call.
- Industry moves the number as much as channel. Paid search leads swing from about $28 in automotive repair to $132 for attorneys, and blended figures reach into the hundreds for competitive sectors like cybersecurity.
- Benchmark from your own economics. Multiply lifetime value by margin and close rate to find the most you can afford, then check that ceiling against the charts instead of copying them.
- The cheapest lead is rarely the best. Low-cost, low-intent traffic often costs more per customer, so measure cost per qualified lead and respond fast to protect the value of the leads you already bought.
TAGS

Written by
Daniel SemeckyCo-founder & CEO
Daniel is the co-founder and CEO of Glimpze. He spends his days talking to revenue teams about how to catch high-intent visitors before they bounce, and writes about inbound sales, lead conversion, and building a motion where marketing and sales actually share a number.


