
On this page
Two SaaS companies buy the same 10,000 sign-ups. One turns 4,200 of them into people who use the product for what it actually does. The other turns 1,500. A year later the first company has several times the revenue. Both companies paid for the same users. One of them simply turned far more of those users into people who stuck around.
That difference has a name. Activation rate is the share of new sign-ups who reach the moment your product delivers its core value, and it sits at the exact seam where paying to get users turns into keeping them. Measure it honestly and it will tell you, weeks ahead of any retention chart, whether this month's cohort is going to grow or quietly leak away.
This post covers what counts as activation, how to choose your activation moment, how activation differs from the aha moment, how to measure the rate without fooling yourself, what a good number looks like, why it predicts retention and revenue, and the moves that reliably improve it.
What counts as activation?
Activation counts when a new user completes the specific in-product action that proves they have experienced your product's core value, rather than just creating an account.
Signing up is not activation. Neither is logging in, clicking around, or finishing a product tour. Those are steps on the way. Activation is the first time a user does the thing your product exists to do and gets something back for it: imports the data and sees a live dashboard, sends the first message that gets a reply, publishes the first page, runs the first workflow that succeeds.
The action is specific to your product. As MetricHQ frames it, activation is any action the business determines to be a success factor in the customer journey, one that is known or assumed to deliver initial value. An ecommerce product might treat a first purchase within two weeks as the signal. A collaboration tool might treat the first shared document. The point is that a real person crossed from curiosity into use.
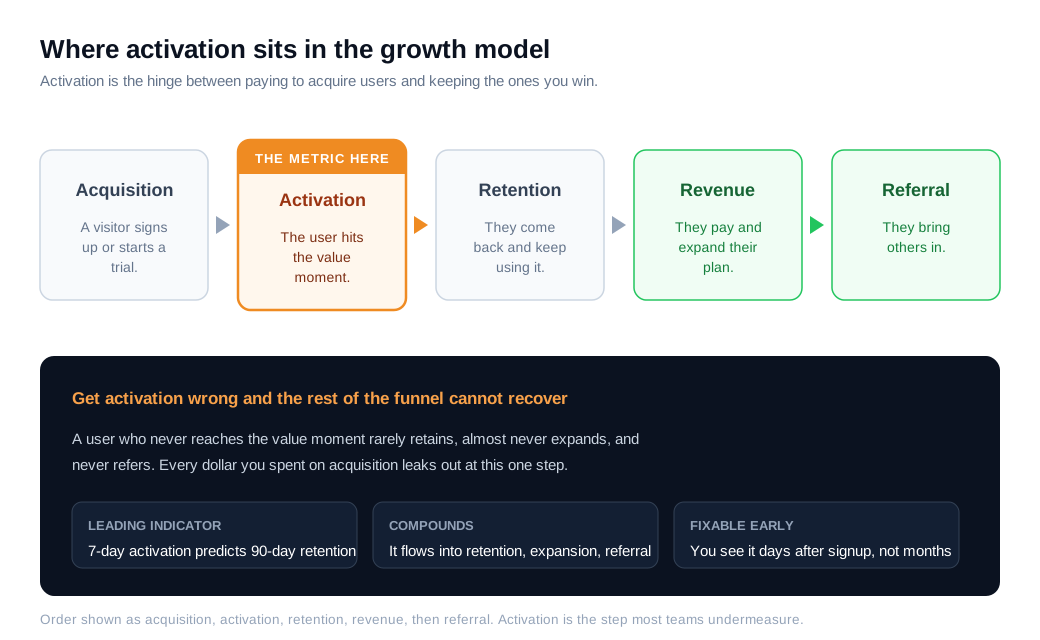
Activation is one of the classic pirate metrics, the AARRR sequence of acquisition, activation, retention, revenue, and referral. Its position in that chain is why it matters so much. A user who never activates almost never retains, rarely expands, and never refers, so the money you spent acquiring them leaks out at this one step. Everything downstream inherits the size of your activation rate.
How do you define your activation moment?
Define your activation moment by finding the single early action that most reliably separates users who stay from users who churn, then treating completion of that action as your activation event.
The method is empirical, not a guess. Take a large set of past users and split them into two groups: the ones still active after 30, 60, or 90 days, and the ones who left. Then look backward for the earliest in-product behavior that the retained group did and the churned group mostly did not. That behavior is your candidate activation event.
The most quoted example comes from Facebook. Its first VP of Growth, Chamath Palihapitiya, has described how the growth team compared cohorts of engaged and disengaged users and found one pattern that stood out: users who reached seven friends in their first ten days almost always stuck around, while users who did not tended to drop off. The team made "seven friends in ten days" its single focus and organized onboarding to push every new user toward it. Slack landed on a team sending roughly 2,000 messages. Dropbox pointed at putting one file in one folder. Each is different because each product delivers value differently.
A good activation event has four traits. It correlates strongly with long-term retention, so it actually predicts something. It happens early, ideally in the first session, so you can influence it. It is inside the user's control, not gated behind a sales call or a teammate's approval. And it maps to real value rather than a vanity click. Resist the urge to treat the exact number as sacred. The discipline is what pays off: pick one leading indicator that tracks real value, then build the whole first-run experience around getting new users to it.
What is the difference between activation and the aha moment?
The aha moment is when a user realizes your product is valuable; activation is the observable behavior that shows they got there.
One is a feeling inside the user's head, and you cannot query a feeling. The other is an event in your analytics that you can count, chart, and compare across cohorts. You design onboarding to create the aha, and you measure activation as its proxy. Sometimes they are the same moment. Often the activation event is a slightly later action that confirms the realization stuck, like coming back the next day to do the valuable thing again. Keep the two ideas linked but distinct: the aha is the goal, activation is the yardstick.
How do you measure activation rate?
Measure activation rate by taking a cohort of users who signed up in a fixed period, counting how many completed your activation event within a set time window, and dividing the second number by the first.
(Activated users in the cohort ÷ Sign-ups in the cohort) × 100 = Activation rate
Say 500 people sign up in the week of February 10, and 185 of them complete your activation event within 7 days. The activation rate for that cohort is 185 divided by 500, times 100, which is 37%. The arithmetic is trivial. The definitions underneath it are where teams quietly mislead themselves.
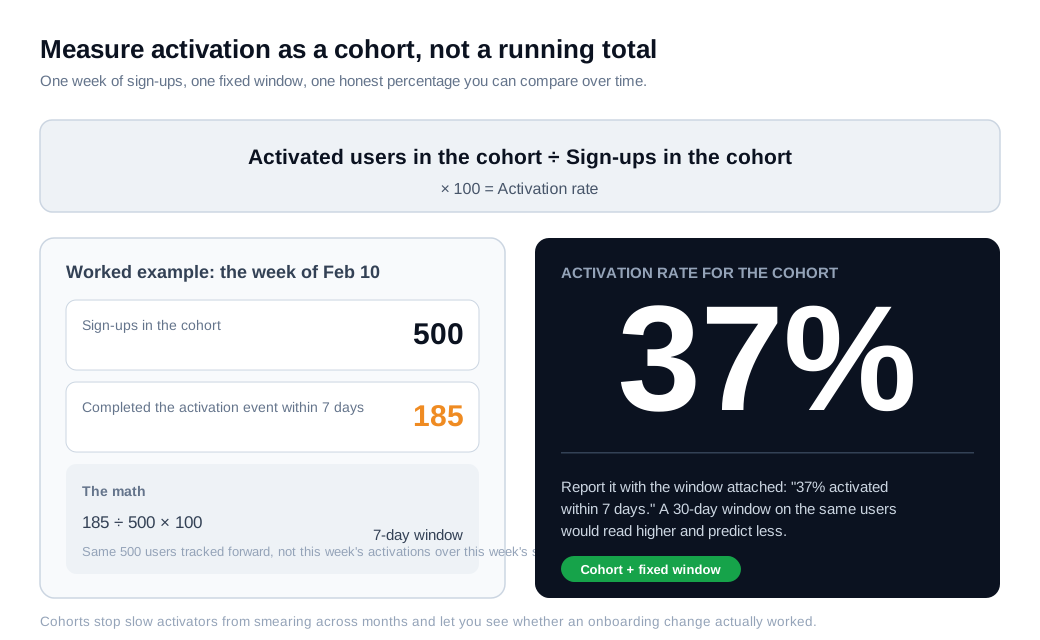
Three choices move the number more than the math does. First, measure a cohort, not a blended pool. Group users by the week or month they signed up and track that fixed group forward, instead of dividing this week's activations by this week's sign-ups. Blended numbers smear slow activators across time periods and hide whether an onboarding change actually worked. Klipfolio and MetricHQ both frame activation as a cohort calculation for this reason.
Second, define the event precisely, because the definition sets the number. In MetricHQ's own example, if 100 of 500 new users perform the key action in the first week, the rate is 20%. Move the bar to an easier action and the same users produce a higher rate that predicts less. Pick the event that tracks value, then hold it steady so the trend line means something.
Third, choose a time window and state it every time. A 7-day window is common for self-serve products, and a 14-day window is common for B2B where setup takes longer. The same users will report a higher activation rate over 30 days than over 7, so a number without a window attached is close to meaningless. Say "37% activated within 7 days," not just "37%."
What is a good activation rate?
A good activation rate depends on your product and motion, but Userpilot's 2024 benchmark of 62 B2B companies puts the average at 37.5% and the median at 37%, so the mid-to-high 30s is a fair center of gravity for B2B SaaS.
The spread around that median is wide, which is the real lesson. In the same Userpilot benchmark report, healthcare products averaged 23.8% while AI and machine learning products averaged 54.8%. Motion matters too. Self-serve products carry more tire-kickers who sign up out of idle curiosity, so their blended activation runs lower, while sales-assisted and enterprise products, where a human helps users through setup, tend to sit higher.
So treat any single benchmark as a rough sanity check rather than a target. Measure your own cohort honestly, segment it by acquisition source, and improve against last quarter. A user from branded search and a user from a cold ad land on the same product and activate at very different rates, and a blended average hides that. If you want a second lens, Amplitude's 7% retention rule offers one: a day-seven return rate of 7% places a product in roughly the top quartile for activation, and it reads as a strong early signal of durable retention.
Why does activation predict retention and revenue?
Activation predicts retention and revenue because it is the earliest point at which a user's behavior reveals whether they found value, and users who find value early tend to stay, expand, and pay, while users who never reach it rarely return.
Amplitude's research is direct about the size of the effect. It reports that early activation is the most reliable predictor of long-term retention, outweighing both acquisition volume and later engagement growth, and that seven-day activation performance gives you an early read on three-month retention. That is the practical value of the metric. Instead of waiting a full quarter to watch a retention curve settle, you can see days after signup whether a cohort is on track.
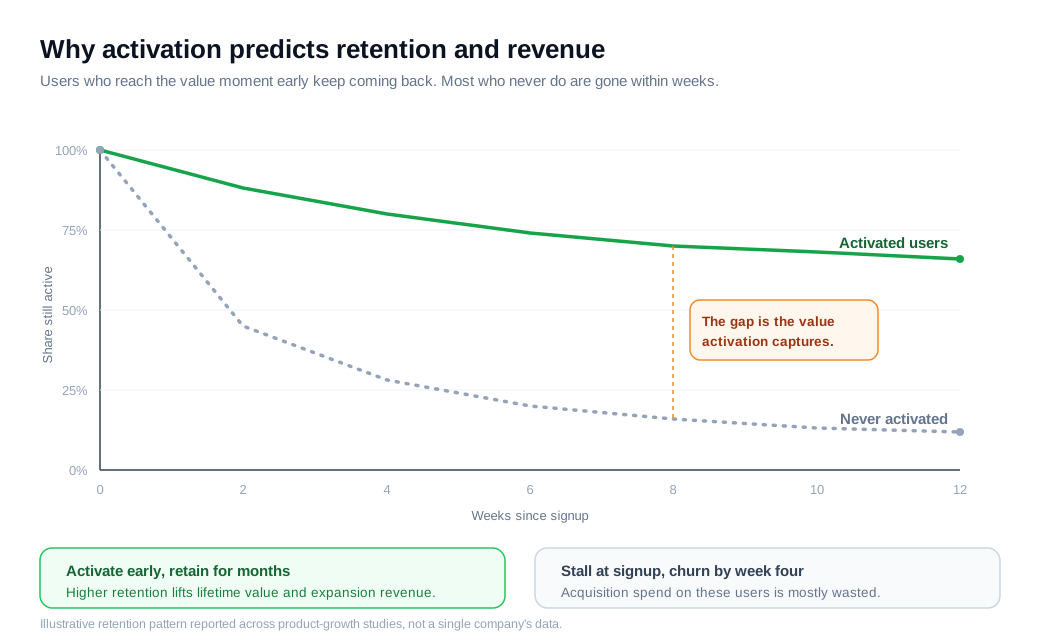
The revenue link follows from the compounding. Higher retention raises lifetime value, retained users are the ones who expand their plans, and happy long-term users are the ones who refer others. A single point of activation flows through every stage below it in the funnel, which is why improving activation usually beats improving almost any downstream number. It is also the cheapest place to work, because the users are already yours. You paid to acquire them, and activation decides whether that spend turned into a customer or a bounce.
There is a timing advantage on top of the size advantage. Because activation shows up so early, a weak cohort is still reachable when you spot it. A retention problem you notice at month three is mostly a post-mortem. An activation problem you notice on day three is a cohort you can still rescue.
How do you improve activation?
Improve activation by shortening the path to the value moment, pointing every new user at one clear first action, and adding a human touch at the points where high-intent users stall.
Compress time to value. The single biggest lever is getting users to real value faster. Preload sample data so a new account is not a blank page, ship templates so the first useful outcome is one click away, and cut any setup step that is not strictly required to see the product work. Empty states are where activation goes to die, because a blank dashboard feels like homework instead of a demo.
Build onboarding around one activation goal. Pick the single action that best predicts retention and design the first session around it. A short checklist of three to five outcome-based steps ("import your data," "invite a teammate," "publish your first report") consistently beats a passive product tour, because it gives the user a reason to move rather than a thing to watch.
Personalize the first run. A one-question welcome screen that captures role or use case lets you route a new user straight to the workflow they came for, instead of dropping everyone into the same generic starting point.
Add a human touch where intent is high. This is the most underused lever in self-serve products. A new user who stalls halfway through setup, or lingers on a pricing page mid-trial, is the most valuable and most fragile traffic you have. Reaching that person in the moment, with a live chat message or a quick call, converts interest that an email drip would let cool. When the sticking point is easier to show than to type, a short screen-share or video call walks the user past it in a couple of minutes. You do not need to chase every free sign-up. You need a way to talk to the small set of users showing real intent, which is the core of a modern inbound sales motion built on speed. Proactive outreach nudges can open that conversation automatically the moment a user stalls, so a person steps in exactly where activation is at risk.
Trigger help by behavior, not by calendar. Fire a nudge, a tip, or a human handoff when a user gets stuck on a step, not on a fixed day of the trial. The context does the persuading, and the help lands while the problem is live.
Above all, treat your activation funnel as the map. Chart the drop-off at each step from sign-up to the value moment, find the biggest leak, and fix that one first. Activation work compounds, because every point you add flows straight into retention, revenue, and the cost of acquiring the next customer.
Key takeaways
- Activation is behavior, not signup. It counts only when a new user completes the in-product action that proves they reached your core value, which is why it sits between acquisition and retention in the funnel.
- Define the moment from data. Compare retained and churned cohorts, find the earliest action that separates them, and pick an event that is predictive, early, in the user's control, and tied to real value.
- Measure it as a cohort with a fixed window. Divide activated users by sign-ups in the same cohort, times 100, and always state the window, since a 7-day rate and a 30-day rate describe the same users differently.
- Benchmark against your own motion. Userpilot's 2024 study put the B2B average near 37.5% and the median at 37%, but verticals ranged from about 24% to 55%, so beat your own last quarter rather than a headline number.
- Activation predicts the rest of the business. It is the earliest reliable signal of long-term retention, and every point of it compounds through retention, expansion, and referral revenue.
- Improve it by shortening time to value. Preload data, guide users to one activation action, and add a human touch through live chat or a quick call when high-intent users stall.
TAGS

Written by
Daniel SemeckyCo-founder & CEO
Daniel is the co-founder and CEO of Glimpze. He spends his days talking to revenue teams about how to catch high-intent visitors before they bounce, and writes about inbound sales, lead conversion, and building a motion where marketing and sales actually share a number.


