
On this page
Two companies sell the same product at the same price. One spends $400 to win a customer, the other spends $1,600. On paper their revenue looks identical. In practice, the first company can outspend, outlast, and outgrow the second on every channel, because it keeps three times as much margin from each sale to reinvest.
That gap is customer acquisition cost, and it quietly decides which businesses get to compound and which stall out. It is one of the few numbers that ties marketing, sales, and finance together, and most teams measure it loosely or ignore it until growth gets expensive.
This post covers what CAC is, how to calculate it correctly, what a good number looks like against benchmarks and the LTV ratio, how to read the CAC payback period, what pushes the cost up, and the concrete moves that bring it back down, including the one most teams overlook: converting more of the traffic they already pay for.
What is customer acquisition cost?
Customer acquisition cost is the total amount a business spends on sales and marketing to win one new customer over a set period. It answers a plain question. If you add up everything you spent to bring customers in, and divide by how many you actually landed, what did each one cost?
The number matters because it sets the ceiling on how much a customer can be worth to you. If a customer generates $900 in lifetime margin and costs $1,200 to acquire, you lose money on every sale no matter how good the product is. Track CAC over time and you can see whether growth is getting more efficient or slowly eating itself.
CAC also travels well between teams. Marketing reads it as cost per acquisition, sales as the loaded cost of closing, and finance as the input to unit economics. When those groups argue about budget, CAC is usually the number that settles it.
How do you calculate CAC?
You calculate CAC by dividing total sales and marketing spend for a period by the number of new customers acquired in that same period. The formula is short. The discipline is in what you include.
CAC = total sales and marketing cost / new customers acquired.
The mistake most teams make is counting only ad spend. A fully loaded CAC includes advertising, the salaries of everyone in sales and marketing, commissions and bonuses, the software and tools those teams run on, agency and content costs, and a share of overhead, as Zendesk lays out in its CAC guide. Leave the salaries out and your CAC looks great and predicts nothing.
Here is a worked example for a B2B SaaS company over one quarter.
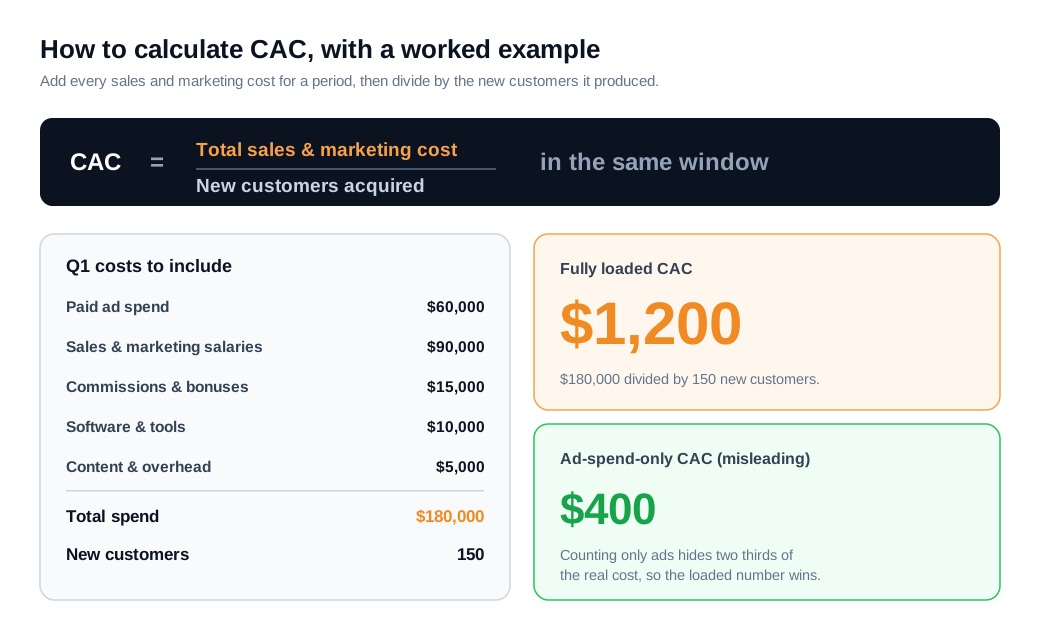
The company spent $60,000 on ads, $90,000 on sales and marketing salaries, $15,000 on commissions, $10,000 on tools, and $5,000 on content and overhead. That is $180,000. It closed 150 new customers in the quarter. Fully loaded CAC is $180,000 divided by 150, or $1,200 per customer. Count only the ad spend and you get $400, a number that hides two thirds of the real cost and will lead you to overspend.
Two refinements are worth knowing. Blended CAC divides total spend by all new customers, including the ones who arrived through organic search or word of mouth. Paid CAC isolates the customers a specific paid channel produced, so you can judge that channel on its own. Blended CAC tells you the health of the whole engine. Paid CAC tells you which parts to keep funding. Most teams should track both and never mix them up in the same sentence.
Timing matters too. There is often a lag between spend and the customer it produces, especially in longer sales cycles, so a quarter with heavy spend and few closes shows a CAC spike that has nothing to do with efficiency. Match the spend to the cohort it acquired, or measure over a wide enough window to smooth the lag.
What is a good CAC and CAC to LTV ratio?
A good CAC is any number that stays comfortably below the lifetime value of the customer it buys, and the standard test is a lifetime-value-to-CAC ratio of about 3 to 1. For every dollar you spend acquiring a customer, you want roughly three dollars of gross margin back over their lifetime.
The ratio matters more than CAC alone because a high CAC can be perfectly healthy if the customer is worth enough. A $10,000 CAC is fine for an enterprise account worth $40,000 in margin. A $200 CAC is a disaster for a product that churns in two months. Wall Street Prep's breakdown of the LTV/CAC ratio frames the bands the same way most investors do: below 1 to 1 you are losing money on every customer, around 3 to 1 is the healthy zone, and above 5 to 1 usually means you are under-investing and leaving growth on the table.
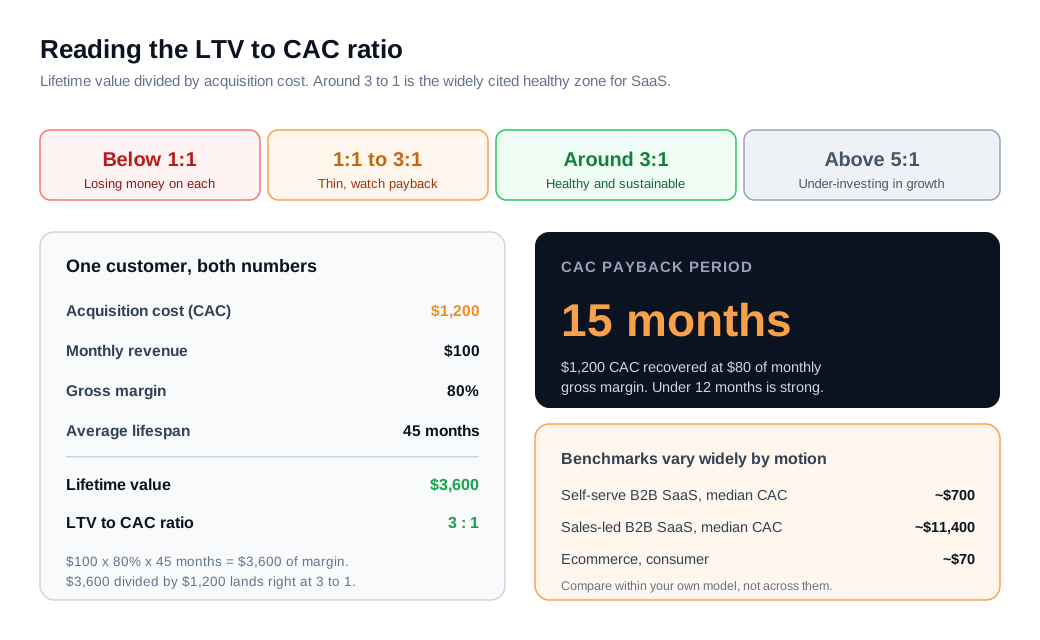
Take the $1,200 CAC from the earlier example. Say the customer pays $100 a month at 80 percent gross margin and stays 45 months. Lifetime value is $100 times 80 percent times 45, or $3,600 of margin. Divide that by the $1,200 CAC and you get exactly 3 to 1. That customer is worth acquiring.
Benchmarks help, as long as you compare within your own model. Aggregated 2026 figures put the median self-serve B2B SaaS CAC near $700 and the median sales-led B2B SaaS CAC around $11,400, a gap that reflects how much more it costs to run a human sales motion than a product-led one, per industry benchmark data compiled by Userpilot. Ecommerce sits far lower, often under $100 per consumer customer, while fintech, insurance, and education run high because of compliance, longer cycles, and heavier trust barriers. A $1,200 CAC that would sink an ecommerce brand is unremarkable for sales-led software.
What is a good CAC payback period?
CAC payback period is the number of months it takes to earn back the cost of acquiring a customer from the gross margin they generate, and under 12 months is generally considered strong. It is the cash-flow companion to the LTV ratio: the ratio tells you if a customer is profitable eventually, and payback tells you how long your money is tied up before that starts.
The math is simple. Take CAC and divide by the monthly gross margin per customer. With the $1,200 CAC, a $100 monthly plan, and 80 percent margin, you recover $80 a month, so payback is $1,200 divided by $80, or 15 months. That is workable but not fast. Faster payback frees cash to acquire the next customer sooner, which is why it compounds.
Benchmarks have drifted up as acquisition has gotten harder. Geckoboard's reference on the metric notes that many SaaS companies now sit well above the old 12-month target, with medians commonly reported in the 14 to 18 month range and top-quartile performers recovering CAC in under 6 months. Enterprise segments run longer than SMB because the deals are bigger and slower. Judge yourself against your own segment, then work to shorten the number.
What drives CAC up?
CAC goes up when it takes more spend, more people, or more time to produce the same customer, and over the past few years all three have moved the wrong way. Much of the increase is structural and outside any single team's control.
Several forces are pushing in the same direction:
- Paid channels cost more and target worse. Ad auctions are more crowded every year, and privacy changes have degraded the signals those platforms run on. Apple's App Tracking Transparency, rolled out in 2021, cut deterministic tracking on the major ad networks sharply, and third-party cookie deprecation removed another layer. The result is higher cost per impression and looser targeting at the same time. Analysts tracking the trend, drawing on ProfitWell and SimplicityDX data, estimate CAC has risen more than 60 percent over roughly five years.
- Sales cycles are longer and more crowded. B2B deals now involve more stakeholders and take more touches to close. Reported average B2B SaaS sales cycles have stretched past four months, which means more nurturing cost and more sales time per won deal.
- Competition bids up the same buyers. When more vendors chase the same keywords, the same lists, and the same accounts, the clearing price for attention rises for everyone.
- Rising input costs. SDR and marketing compensation, agency fees, and software all cost more than they did, and those flow straight into loaded CAC.
- Slow follow-up wastes the spend. This one is self-inflicted. You pay to generate a lead, then let it sit. Every hour of delay lowers the odds it converts, so the effective cost of each customer you do land climbs.
The first four are headwinds you manage. The last is a leak you can close this week, and it leads directly into how to lower CAC.
How do you lower CAC?
You lower CAC by getting more customers from the same spend or the same customers from less spend, and the moves that work best usually target conversion and retention rather than ad budgets. Cutting ad spend without fixing conversion just buys fewer customers at the same cost per head. The durable wins change the ratio.
A practical set of moves, roughly in order of impact:
- Convert more of the traffic you already have. Conversion rate optimization raises the number of customers per dollar without touching the media budget. It is the single most reliable way to bring CAC down, and it gets its own section below.
- Respond to leads while intent is hot. The classic MIT and InsideSales.com study found that contacting a lead within five minutes rather than thirty makes you about 100 times more likely to reach them and 21 times more likely to qualify the lead. Yet average B2B response times still run into the tens of hours. Closing that gap converts leads you have already paid for, which lowers cost per customer directly.
- Lean on referrals and word of mouth. Referred customers cost less to acquire and tend to be better customers. Industry data compiled by Extole puts referred customers at meaningfully higher retention and lifetime value than customers from paid channels, since a trusted recommendation clears the credibility barrier that paid ads have to buy their way past.
- Improve retention so the ratio holds. Retention does not lower CAC on its own, but it raises lifetime value, which improves the LTV-to-CAC ratio and lets you afford a higher CAC where it is worth it. It also fuels referrals.
- Kill your weakest channels. Track paid CAC per channel and stop feeding the ones with the worst ratio. Reallocating to your efficient channels lowers blended CAC without any new tactic at all.
- Sharpen targeting and content. Better-qualified traffic converts higher and wastes less spend on people who were never going to buy. Content and organic search lower blended CAC over time by bringing in customers you did not pay a platform for.
Notice how many of these tie back to conversion. Traffic is expensive and getting more so. What you do with it is where the cost is won or lost.
How does converting more existing traffic reduce CAC?
Converting more of your existing traffic reduces CAC because the cost is fixed and the customer count is not: if you pay the same to bring visitors in but turn more of them into customers, the cost per customer falls by exactly that proportion. It is arithmetic, and it is the reason conversion work outperforms most spending decisions.
Walk the math. Suppose you spend $10,000 a month and it brings 10,000 visitors to your site. At a 2 percent conversion rate you get 200 customers, so CAC is $10,000 divided by 200, or $50. Raise conversion to 3 percent and the same traffic produces 300 customers. Now CAC is $10,000 divided by 300, which is about $33. You cut cost per customer by a third and did not spend a dollar more on ads.
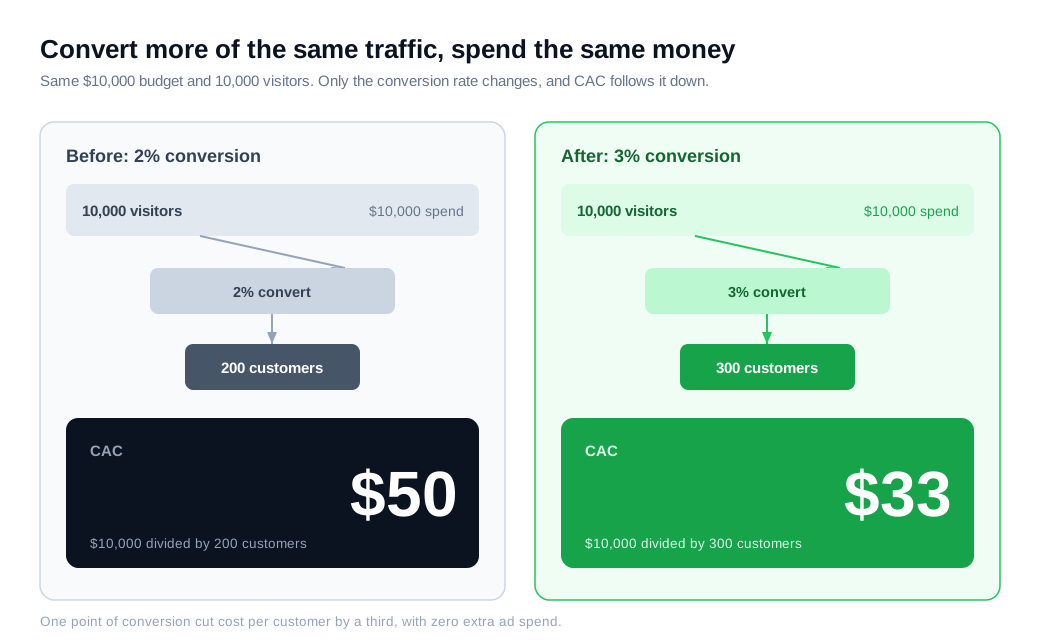
That is why a one-point improvement in conversion can beat a large ad budget increase. Every dollar already flowing through the funnel gets more efficient at once. The improvement compounds with retention, too, because the customers you convert this way cost less and, if they stay, push the LTV ratio further in your favor.
The practical question is what actually lifts conversion. Faster pages, clearer copy, stronger social proof, and fewer form fields all help. The move with the most immediate effect on high-intent visitors is talking to them while they are still on the page. A visitor parked on your pricing page with a question is the most expensive traffic you will buy all week, and a contact form that promises a reply "within one business day" throws that intent away. Offering live chat at that moment, or escalating to a live video call or screen share when the question is easier to show than to type, converts the interest before it cools. This is the core of an inbound sales motion built on speed, and it is measured directly in the conversion rate that sits in the denominator of your CAC.
Two details make the effect real. The visitor has to reach the right person fast, which is a job for lead routing and instant notifications rather than a shared inbox nobody watches. And you can catch intent earlier with proactive outreach that opens a conversation when a visitor lingers or returns. Both do the same thing: more conversations with the traffic you already paid for, which means more customers per dollar, and a lower CAC.
Key takeaways
- CAC is total sales and marketing spend divided by new customers, and it only tells the truth when you load in salaries, commissions, tools, and overhead rather than counting ad spend alone.
- The LTV-to-CAC ratio is the real test, with about 3 to 1 as the healthy target, below 1 to 1 meaning you lose money per customer, and above 5 to 1 hinting you are under-investing in growth.
- CAC payback period tracks how fast the cash comes back, so aim to recover acquisition cost in under 12 months even though many SaaS companies now sit in the 14 to 18 month range.
- CAC has risen structurally, more than 60 percent over roughly five years, driven by pricier and less accurate paid channels, longer sales cycles, and more competition for the same buyers.
- Conversion and speed beat budget cuts, because raising the share of existing traffic that converts lowers cost per customer proportionally, with no extra ad spend.
- A one-point conversion gain can outperform a big ad increase, as moving from 2 to 3 percent conversion on the same traffic cuts CAC by a third, and talking to high-intent visitors in the moment is one of the fastest ways to get there.
TAGS

Written by
Daniel SemeckyCo-founder & CEO
Daniel is the co-founder and CEO of Glimpze. He spends his days talking to revenue teams about how to catch high-intent visitors before they bounce, and writes about inbound sales, lead conversion, and building a motion where marketing and sales actually share a number.


