
On this page
- What is feature adoption?
- How do you measure feature adoption?
- What is a good feature adoption rate?
- What is the difference between feature adoption and product adoption?
- How do you drive adoption of key features?
- How does feature adoption affect retention?
- What are the most common feature adoption mistakes?
- Key takeaways
- Sources
A team spends a quarter building a feature, ships it with a launch email, and moves on to the next thing on the roadmap. Three months later someone charts usage and finds that four in five features the company has ever built get almost no use. The shiny new one has quietly joined that pile.
That pattern shows up across the industry. In its 2019 Feature Adoption Report, Pendo analyzed usage across 615 subscriptions and found that 80 percent of features in the average software product are rarely or never used, while just 12 percent of features drive 80 percent of daily usage. Building the feature was the easy part. Getting people to adopt it is the work that decides whether it ever earns back its cost.
This post covers what feature adoption is, how to measure it, what a good adoption rate looks like, how it differs from product adoption, the tactics that reliably drive it, how it feeds retention, and the mistakes that keep good features buried.
What is feature adoption?
Feature adoption is the process by which users discover a specific feature, start using it, and fold it into their regular workflow. Where product adoption asks whether people use your product at all, feature adoption zooms in on one capability and asks whether the people who could benefit from it actually do.
Most teams turn that into a number, the feature adoption rate: the share of eligible users who have used a given feature within a defined window. "Eligible" is the load-bearing word. Count only the users who can reach the feature and have a reason to use it, or the rate will punish you for people who were never the audience.
Adoption is a funnel rather than a single event. A user moves through four stages, described well in Appcues' guide to feature adoption: exposed, where they encounter the feature through an announcement, a tooltip, or organic discovery; activated, where they take a first meaningful action with it; used, where they return to it as part of normal work; and used again, where the habit sticks.
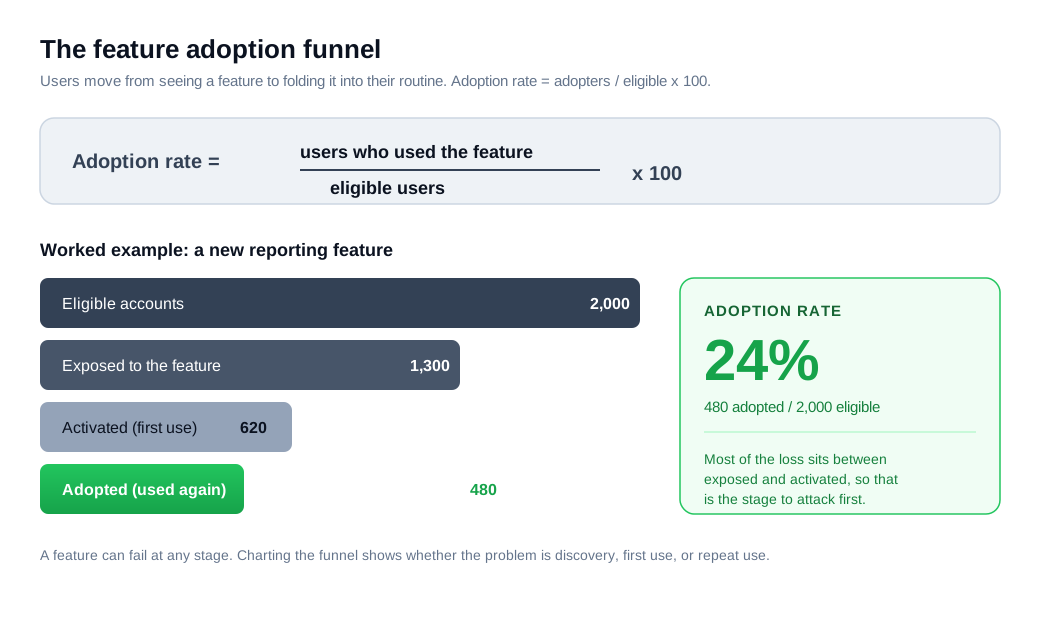
Naming the stages matters because a feature can fail at any one of them, and the fix is different at each. A feature nobody sees has a discovery problem. A feature people try once and abandon has a value or usability problem. A blended adoption number hides which of those is happening, so the stages are what turn a vague worry into a specific thing to fix.
How do you measure feature adoption?
You measure feature adoption by dividing the users who used the feature by the users who were eligible to use it, then multiplying by 100, and by tracking a small stack of metrics around that headline rate. The single number tells you the size of the gap. The supporting metrics tell you where it comes from.
Feature adoption rate = (users who used the feature / eligible users) x 100, the same calculation Count.co lays out in its feature adoption glossary.
Here is a worked example. Suppose 2,000 accounts have access to a new reporting feature this month and 480 of them run at least one report. Divide 480 by 2,000 to get 0.24, multiply by 100, and the adoption rate is 24 percent. Clean arithmetic, but it says nothing about whether those 480 accounts came back or whether the other 1,520 ever saw the feature.
Four supporting metrics round out the picture:
- Breadth of adoption: what share of your active users have tried the feature at all.
- Depth of adoption: how heavily the adopters use it, which separates casual users from power users.
- Time to adopt: how long it takes from a user's first exposure to their regular use.
- Feature retention: how many adopters are still using the feature weeks later, which separates a formed habit from one-time curiosity.
Read all of it by cohort, grouping users by the week they signed up or the week the feature launched, and break the funnel out by stage. If most of your loss sits between exposed and activated, you have a first-use problem. If it sits between used and used again, the feature is easy to try and hard to keep. The stage where people fall out points straight at the fix.
What is a good feature adoption rate?
A good feature adoption rate depends on the feature's role, but the headline SaaS numbers sit lower than most teams expect. Userpilot's 2024 SaaS Product Metrics Benchmark Report, drawn from 547 companies, put the median core feature adoption rate at 16.5 percent and the average at 24.5 percent.
The spread inside that average is the useful part. HR products led at 31 percent, because the feature is often part of someone's daily job, while FinTech, insurance, and healthcare trailed, since their products carry compliance-heavy features most users only need occasionally. Sales-led companies edged product-led ones, 26.7 percent to 24.3 percent.
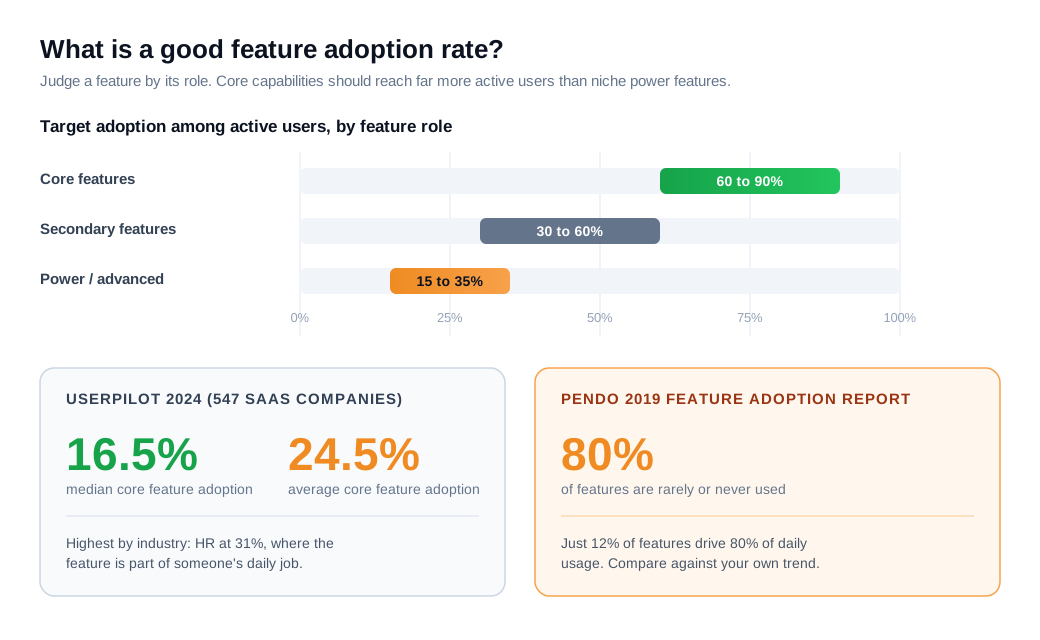
Read those benchmarks against what the feature is for. A core capability that carries your value proposition should reach far more of your active users than a niche power tool. As a working guide, teams often target 60 to 90 percent adoption for core features, 30 to 60 percent for secondary ones, and 15 to 35 percent for advanced or power features, where a lower number can still be healthy if the right segment is the one adopting.
Treat any external figure as orientation, not a target. The comparison that matters is your own trend over time, and whether the users who adopt a feature retain better than the users who never touch it. If adopters and non-adopters retain at the same rate, the feature is being clicked without doing real work, which is a different problem than low adoption.
What is the difference between feature adoption and product adoption?
Product adoption measures whether users engage with your product as a whole, while feature adoption measures whether they engage with one specific capability inside it. Product adoption is a macro health metric. Feature adoption is a micro one, as the Product-Led Alliance breakdown of the two frames it.
You can post strong product adoption and still have individual features almost nobody uses. That is exactly the Pendo finding: healthy, widely used products stuffed with capabilities that never get touched. By Pendo's estimate, publicly traded cloud companies collectively spent up to $29.5 billion building features that go unused, which is the cost of ignoring the micro view.
The distinction decides where you spend effort. If product adoption is weak, the work is onboarding and core value, the reasons a user stays with the product at all. If product adoption is fine but a specific feature is buried, the work is discovery and in-context guidance for that one feature, a far narrower fix. Diagnosing which of the two you have keeps you from redesigning onboarding when the real issue is a tooltip that never fires.
How do you drive adoption of key features?
You drive adoption of a key feature by making it discoverable, tying it to a job the user already wants done, guiding the first use in context, and reaching the users who stall. Each lever targets a different stage of the funnel, so start by finding the stage where your feature loses the most people.
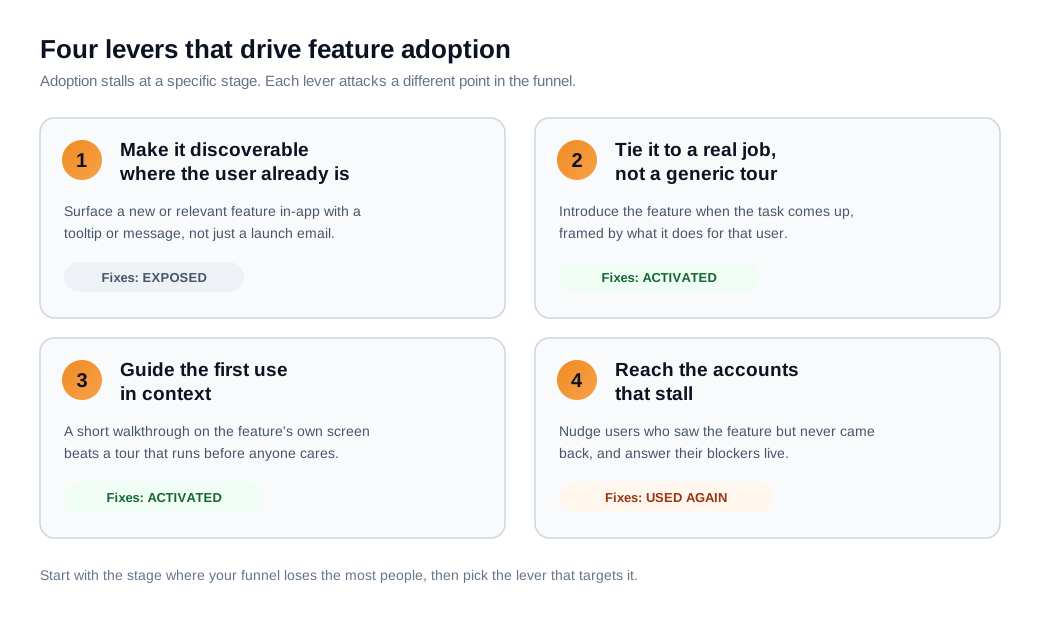
Make it discoverable. Most adoption gaps start at the exposed stage, because users cannot adopt what they never see. Surface a new or relevant feature where the user already is, with an in-app message, a tooltip on the exact screen, or a prompt in an empty state. A welcome message flow can point the right user at the right feature instead of relying on a launch email that most people skip.
Tie it to a job, not a tour. A feature gets adopted when it solves a problem the user has in front of them, so introduce it at the moment that job comes up and frame it by what it does for them. Segment by role or plan so you only promote features that fit, rather than walking every user through every button.
Guide the first use in context. The gap between exposed and activated is usually friction on the first attempt. A short interactive walkthrough that appears when the user opens the feature does more than a generic product tour that runs before anyone has a reason to care.
Reach the users who stall. Instrument the funnel and watch for accounts that saw a feature but never activated, or activated once and did not return. A proactive outreach nudge triggered on that exact stall reaches the user while they still care, and when a setup question is the blocker, answering it in the moment with live chat or a quick screen share can pull a stuck user across the line.
Here is a worked example. A product has a reporting feature with 2,000 eligible accounts and a 24 percent adoption rate, so 480 accounts use it. The team charts the funnel and finds that 1,300 accounts were exposed to the feature but only 620 activated, and of those only 480 came back a second time. Most of the loss sits between exposed and activated. They add a tooltip that opens a one-step walkthrough the first time an account visits the reports tab, plus a nudge that fires when an account views the tab twice without running a report. Over the next quarter, activation from exposure climbs and adoption moves from 24 percent to 33 percent, or 660 accounts, from the same eligible base and no new feature work. The numbers are illustrative, but the method holds: find the stage that leaks, then attack it.
How does feature adoption affect retention?
Feature adoption affects retention because the features a customer folds into their routine are the workflows that tie them to your product, and adoption depth is one of the earliest signals of whether an account will renew or churn. Every feature a customer comes to rely on is another reason to stay and another cost of leaving.
Breadth and depth pull in the same direction. Broad adoption spreads value across the product, so the customer has more parts of it working for them. Deep adoption of a core feature makes that feature part of daily work, which is far harder to walk away from. A customer using one feature casually is easy to lose. A customer with several features wired into their week rarely goes looking for a replacement.
The usage signals show up before the churn does. Gainsight's work on product adoption treats feature adoption as a leading indicator: login frequency, feature adoption, and usage depth move weeks or months ahead of a cancellation, which is why customer teams fold them into the health scores that predict renewal and expansion. A drop in a key feature's usage is an early warning worth a call before the renewal date, not after.
The metric to watch is the retention gap between adopters and non-adopters. Say accounts that adopt your reporting feature renew at 90 percent while accounts that never touch it renew at 70 percent. That 20 point gap is the business case for driving adoption, and it confirms the feature is doing real work rather than just collecting clicks. When the gap is wide, moving the adoption rate moves retention with it, which is what turns a feature investment into a compounding one.
What are the most common feature adoption mistakes?
The most common feature adoption mistake is treating launch as the finish line, shipping a feature with one announcement and assuming the people who need it will find it. Discovery is a stage you have to work, and a single email reaches almost nobody who was busy that day.
A second mistake is chasing adoption of features that do not predict retention. Driving clicks on a capability that adopters and non-adopters keep at roughly the same rate is motion without payoff. Check the retention gap first, and spend your effort on the features where adoption actually keeps customers.
A third is promoting every feature to every user. Blanket tours and a steady stream of in-app messages train people to dismiss whatever pops up, so the one feature that matters gets ignored along with the rest. Segment by who needs a feature and be sparing about when you interrupt.
A fourth is confusing a single click with adoption. One use marks the activated stage; adoption is repeat use that survives past curiosity. Measure feature retention alongside the headline rate, or you will celebrate a spike that quietly fades a week later.
Key takeaways
- Feature adoption runs from discovery to habit for one capability. It moves a user through exposed, activated, used, and used again, and the adoption rate is the share of eligible users who reach real use.
- Measure more than the headline rate. Pair adoption rate with breadth, depth, time to adopt, and feature retention, and read them by cohort and funnel stage so you can see exactly where users drop off.
- Benchmarks run lower than teams expect. Userpilot's 2024 data put median core feature adoption at 16.5 percent and the average at 24.5 percent, so judge a feature against its role and your own trend, not a headline.
- Drive adoption by clearing the stage that leaks. Make the feature discoverable, tie it to a real job, guide the first use in context, and reach the accounts that saw it but never came back.
- Adoption is a retention lever. Adopted features are switching costs, and feature usage depth is one of the earliest signals of whether an account renews or churns, which shows up as a gap between adopters and non-adopters.
- Do not stop at launch. The costly mistakes are treating the announcement as the end, chasing features that do not predict retention, and counting a single click as adoption.

Written by
Daniel SemeckyCo-founder & CEO
Daniel is the co-founder and CEO of Glimpze. He spends his days talking to revenue teams about how to catch high-intent visitors before they bounce, and writes about inbound sales, lead conversion, and building a motion where marketing and sales actually share a number.


